
Silver’s 100:1 Ratio Threshold: The Signal That Minted Millionaires in 1942 (And Why It’s Back)
Lessons from the Past, Targets for the Present, Generational Wealth for the Future.

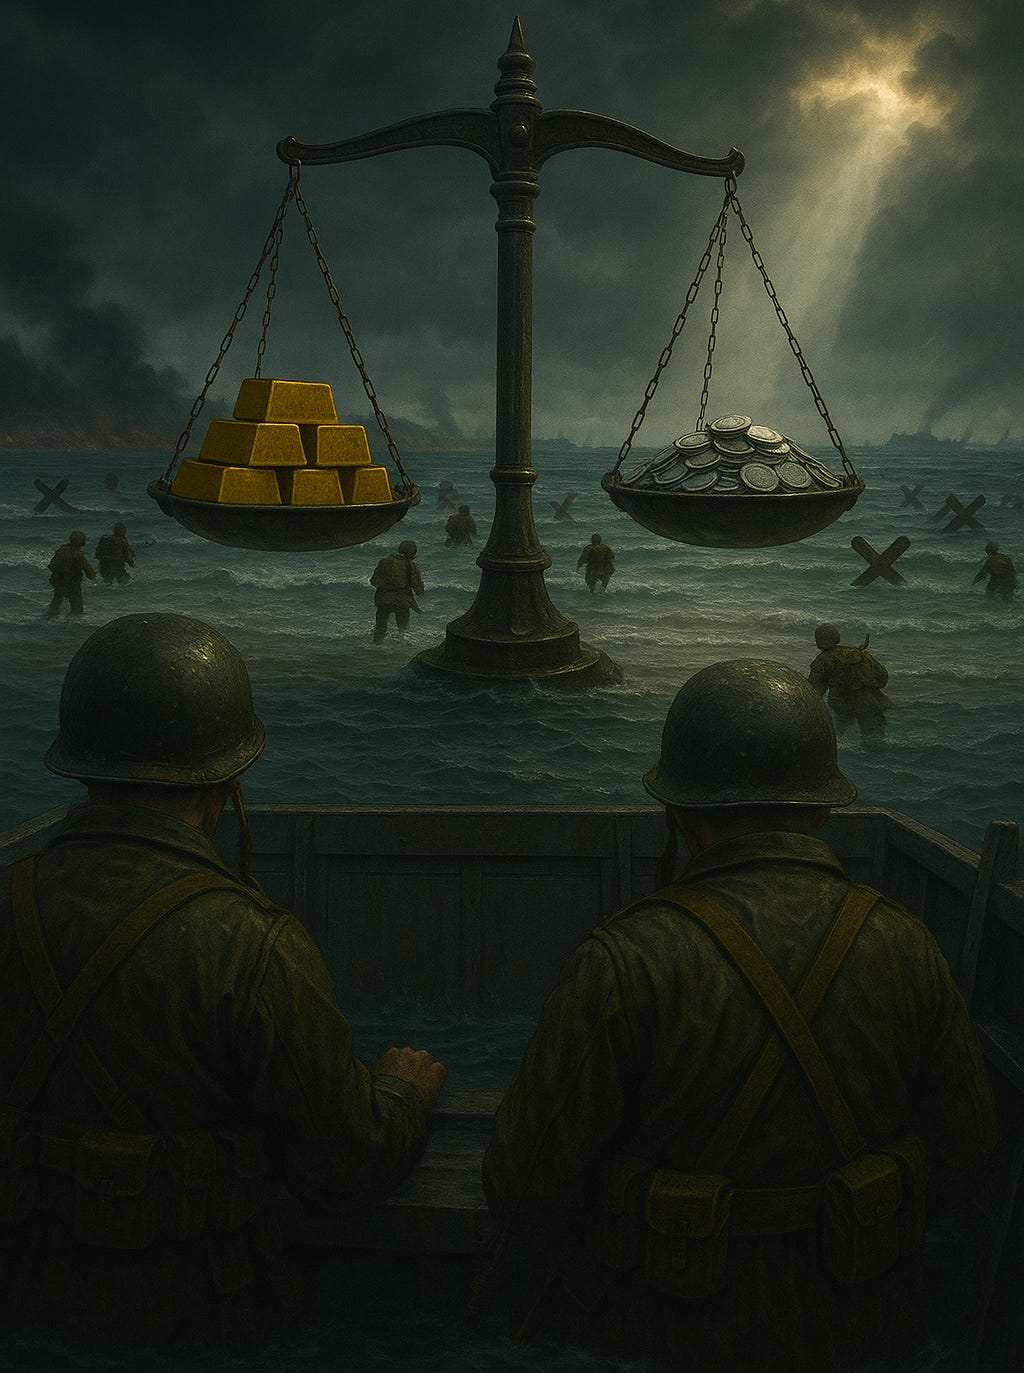
In September 1939, as Hitler & Stalin invaded Poland and the world plunged into war, the gold-to-silver ratio hit 99:1 — a level so extreme it screamed “ABANDON ALL HOPE” for silver.
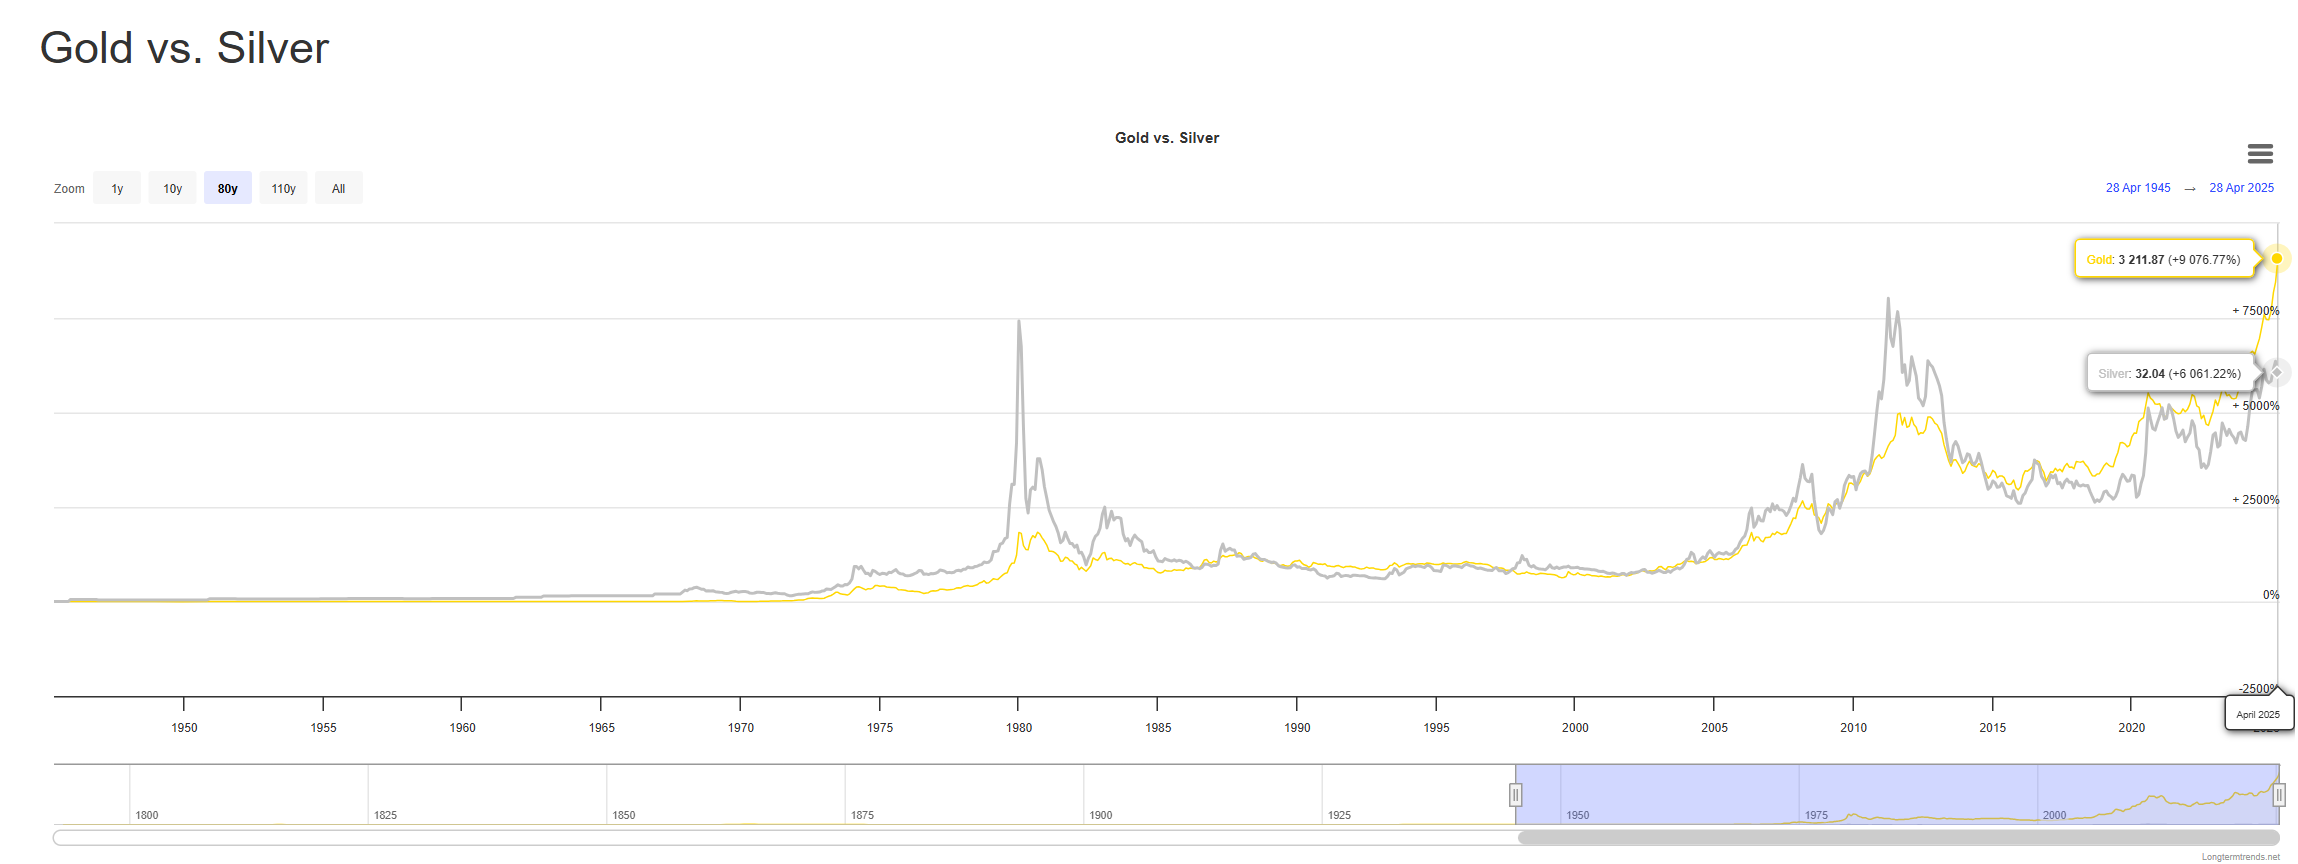
Here’s why most investors missed the boat: The gold-to-silver ratio — the number of ounces of silver needed to buy one ounce of gold — has long captivated historians and precious metals investors alike. While its modern average hovers around 60:1, extreme spikes above 100:1 are rare and mark historically significant and often traumatic societal events.
These moments reveal economic stress, market dislocations, and opportunities for contrarian investors to create generational wealth. Let’s explore the two major historical periods when this ratio crossed into triple digits and what they teach us today.
The Great Depression & Start of World War II (1939)
Ratio Peak: ~99:1 (September 1939)
Context:
The U.S. abandoned the gold standard in 1933 under President Roosevelt’s Gold Reserve Act, which fixed the price of gold at $35 per ounce and made private gold ownership illegal, except for certain exemptions.
Silver, on the other hand, faced declining industrial demand during the Great Depression and was no longer viewed as a key monetary asset. While gold remained a primary store of value, silver’s role in monetary systems diminished as governments focused on gold for financial stability.
Market Dynamics:
Gold’s price was artificially suppressed by government policy, yet it’s safe-haven status kept demand relatively high. In contrast, silver, without similar government backing, fell to about $0.25 per ounce by 1932 due to a lack of industrial and monetary demand.
The gold-to-silver ratio surged as investors flocked to gold, leaving silver—still largely dependent on industrial uses—lagging behind during the Great Depression.
Aftermath:
The ratio remained high through World War II, with silver prices gradually increasing as wartime industrial demand drove price rises. By the early 1940s, silver prices surged to $0.90–$1.00 per ounce, with some reports noting a range up to $1.10–$1.25 per ounce due to increasing industrial demand.
Investors who swapped gold for silver around 1939 would have seen a price increase of approximately 150–250% by 1942, as silver benefitted from a combination of factors, including rising industrial demand during the war.
The COVID-19 Panic (2020)
Gold to Silver Ratio Peak: 125:1 (March 2020)
Context:
Pandemic lockdowns cratered industrial activity, slashing silver demand (50% of which comes from sectors like electronics and solar panels).
Gold, conversely, surged as central banks slashed interest rates and unleashed stimulus, with prices hitting $2,000/oz by August 2020.
Market Dynamics:
Silver briefly collapsed to $12/oz, while gold’s rally pushed the ratio to an all-time high of 125:1.
Investors viewed gold as the “pure” safe haven, while silver suffered a dual identity crisis — part monetary metal, part industrial commodity.
Aftermath:
By August 2020, silver staged a historic rebound +150% in 5 months, soaring from $12 to $30/oz as industrial demand revived and retail investors piled into ETFs.
The ratio collapsed to below 70:1, rewarding those who bought silver at the peak.
Why These Extremes Matter
Silver’s Asymmetric Opportunity: At 100:1, silver is statistically undervalued relative to gold. Historically, such extremes precede explosive silver rallies.
Economic Stress Signals: Triple-digit ratios often coincide with crises (e.g. War, Depression, Covid 19 2020). They reflect gold’s dominance as a crisis hedge and silver’s sensitivity to economic cycles.
Mean Reversion Is Inevitable: Over 5,000 years, the ratio averaged ~15:1. While modern mining and monetary shifts have altered this, reversion to 60:1 or lower remains a recurring theme.
Implications for Today
As of May 2025, the ratio sits near 101:1 — high but not as extreme as our previous high at 125:1. However, lessons from history suggest we have now entered into what I have dubbed the “Generational Wealth Zone” for stackers:
Watch for Triggers: A recession or industrial rebound could reignite silver’s upside. Green energy demand (e.g., solar panels) may structurally boost silver.
Tactical Swaps: Ratio trading or exchanging gold for silver at highs has historically amplified portfolio gains. In 2020, swapping 1 oz of gold for 100 oz of silver would have yielded 2 oz of gold post-recovery.
Patience Pays: Corrections can take months or years. In 1939, the ratio stayed elevated for a decade due to wartime controls. Having targets and a gameplan can help take the fear and greed out of the process for investors.
Gold to Silver Ratio Gameplan: Targets for Today
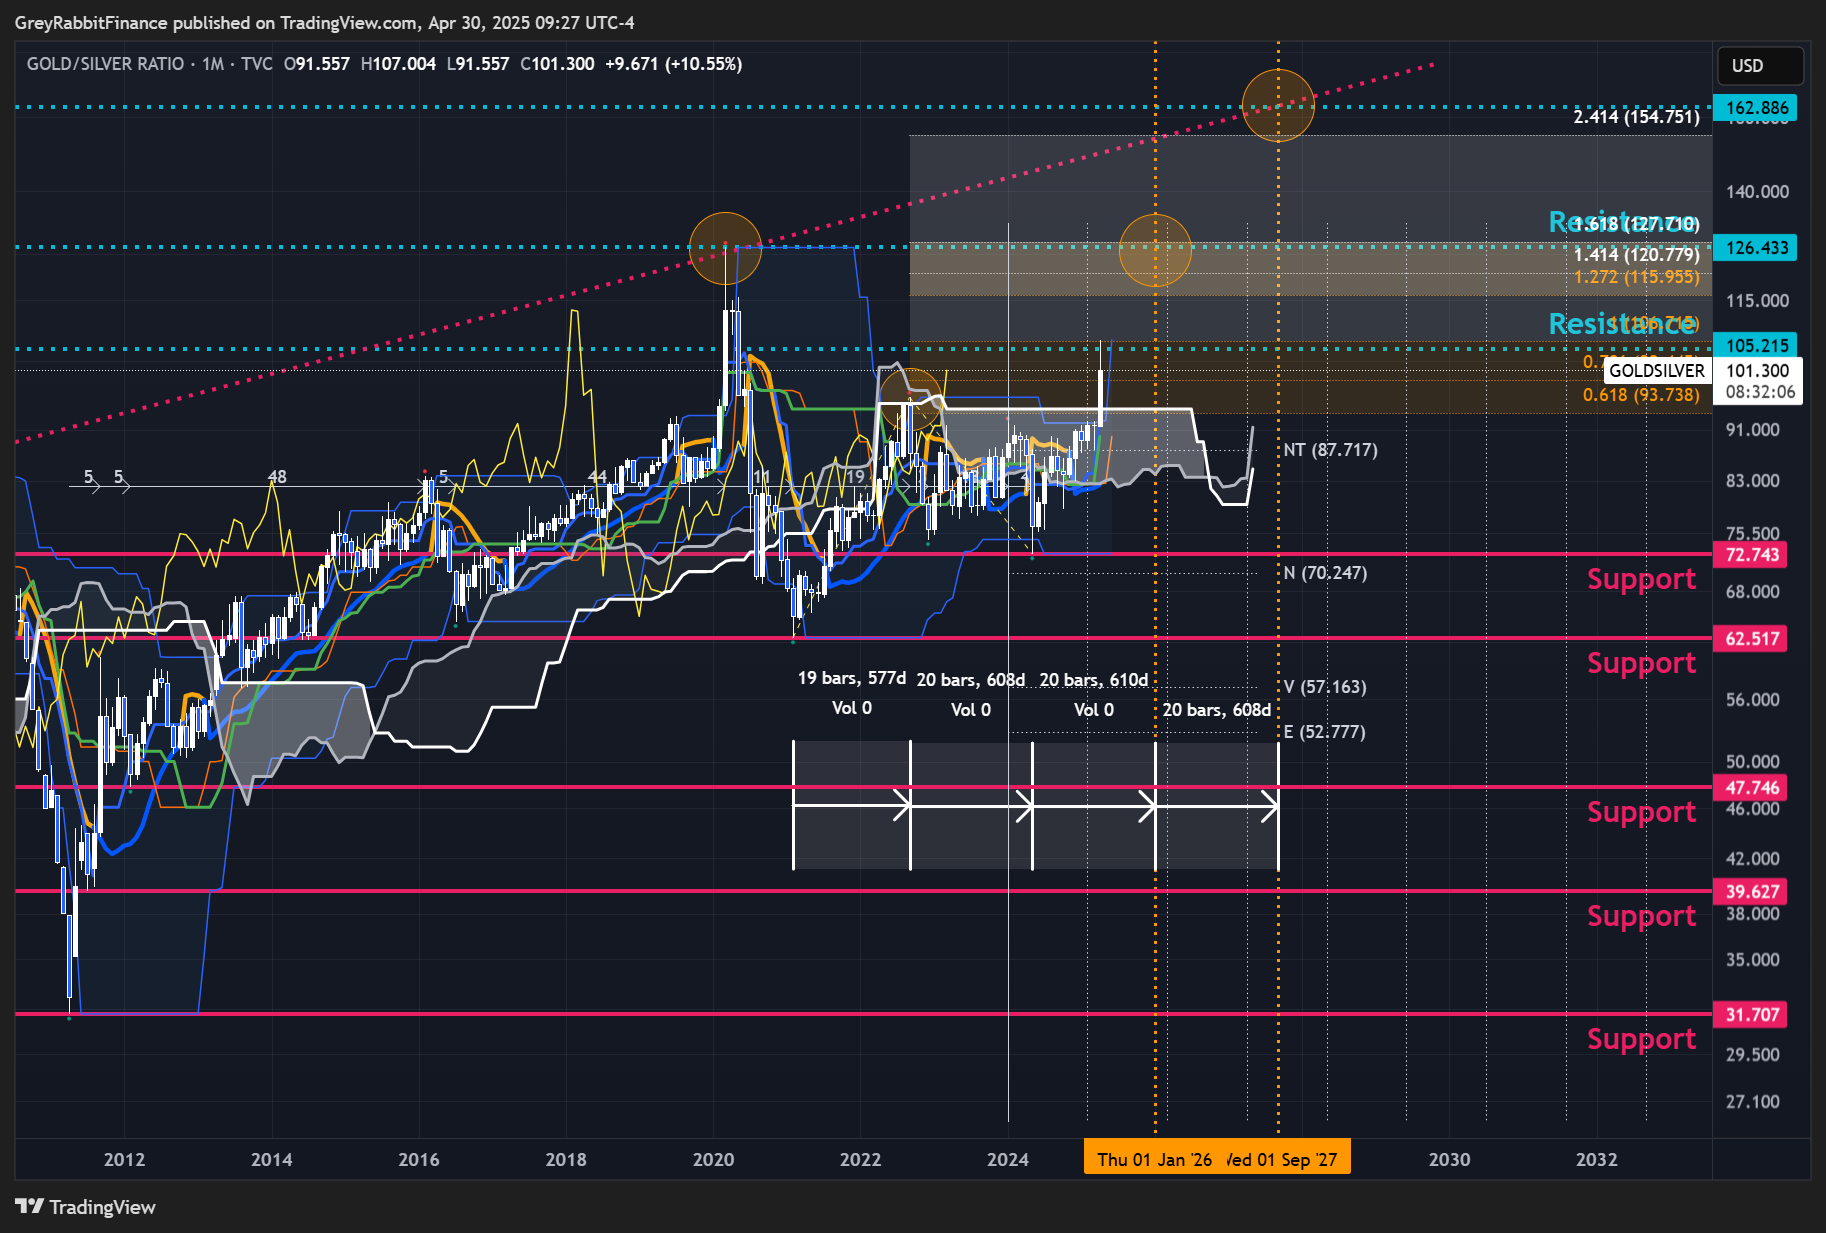
First Major Scenario to Watch For:
If Price Closes on an N-Wave above the 105.21 Resistance level — We could retest the 126.43 & even possibly the upper trend line of 162.88 (Orange Circles). If these levels are reached, I expect an aggressive reversal move to follow.
Second Major Scenario to Watch For:
If Price Closes on an N-Wave below the 72.74 Support level — We can confirm the breakout to the downside. Once this level is broken, I expect an aggressive move to follow and accelerate.
Time Cycle Analysis: We should be confirming either of these bullish/bearish moves by August 2025.
1st Target Level (Pink Line): Support Level 62.51 is a solid first target, here we are nearing the past century’s average price at 1 ounce of Gold to 60 ounces of Silver.
2nd Target Level (Pink Line): Support Level 47.74 is a solid second target, notice how we have confluence with the bottom of the previous Kumo (Cloud).
3rd Target Level (Pink Line): Support Level 39.62
4th Target Level (Pink Line): Support Level 31.70
Simply stated at these levels investors would be looking to swap Silver for Gold.
Interested to learn more about forecasting the market with Ichimoku? Check out my book! ‘At One Glance - Master the Ichimoku Kinko-Hyo with Balance Discipline & Mindset.”
Click Here👉 At One Glance Book
Final Thoughts from the Rabbit Hole
The extreme gold-to-silver ratios is more than a warning signal — it’s a flashing neon sign for astute investors. As billionaire resource investor Rick Rule often says:
“The time to buy is when there’s blood in the streets… even if it’s your own.”
Silver’s bloodbaths at 100:1 have, without fail, set the stage for generational gains. If you're reading this, you're already in the lifeboat. Now it’s time to sound the alarm. Share this with your family and friends — this historic moment deserves everyone's attention.
Stay Vigilant,
-Tyler
Take a moment to vote in the poll and let us know:
Great article! I am old enough to remember when silver was money. I think a primary driver for silver will be the people who can't afford gold. My parents grew up during the Great Depression and left me with a lot of valuable lessons. Many people will be relearning those same lessons the hard way.
Can we all hold hands and scream BOOOYAH?
https://kingcambo812.substack.com/p/fear-and-loathing-in-trader-hell-eee