
Silver 2026: Full Steam Ahead
Five years of supply deficits. Retail hasn’t entered. Cycle symmetry, Ichimoku, and Fibonacci now signal a full-steam-ahead parabola.


Know someone following silver? Share this report.
🌎 Big Picture
Silver enters 2026 with the strongest structural foundation in decades.
Five consecutive years of global supply deficits, surging industrial demand, and tightening inventories have pushed the market full steam ahead into scarcity.
Solar alone now consumes more silver than global mines produce.
India is preparing to re-monetize silver.
Samsung’s solid-state battery breakthrough requires ~1kg of silver per cell.
And corporations are quietly locking in long-term supply before the shortage becomes public.
Meanwhile retail remains absent:
ETF flows flat
Futures positioning muted
Western portfolios barely exposed
This is not a hype cycle.
This is a parabolic setup built on physical constraints… before the crowd arrives.
Our analysis shows the same structure repeating across all anchor timeframes: acceleration, thin clouds, vertical Tenkan, steep Kijun, and multiple price-time convergence zones into 2026.
And the final confirmation?
The gold-to-silver ratio is breaking down… historically the trigger for every major silver outperformance cycle.
When structural deficits meet monetary easing and the GSR rolls over, price doesn’t trend…it revalues parabolically.
With that macro foundation, here is the full 2026 technical roadmap.
1️⃣ Multi-Timeframe Structure (3M → 1M → 1W)
Silver’s annual outlook must be anchored in the high timeframes:
3M (Quarterly): secular regime
1M (Monthly): annual trend structure
1W (Weekly): trend cadence + pullbacks
🖼️ SILVER — 3 Month Chart (Macro Trend & Secular Kijun)
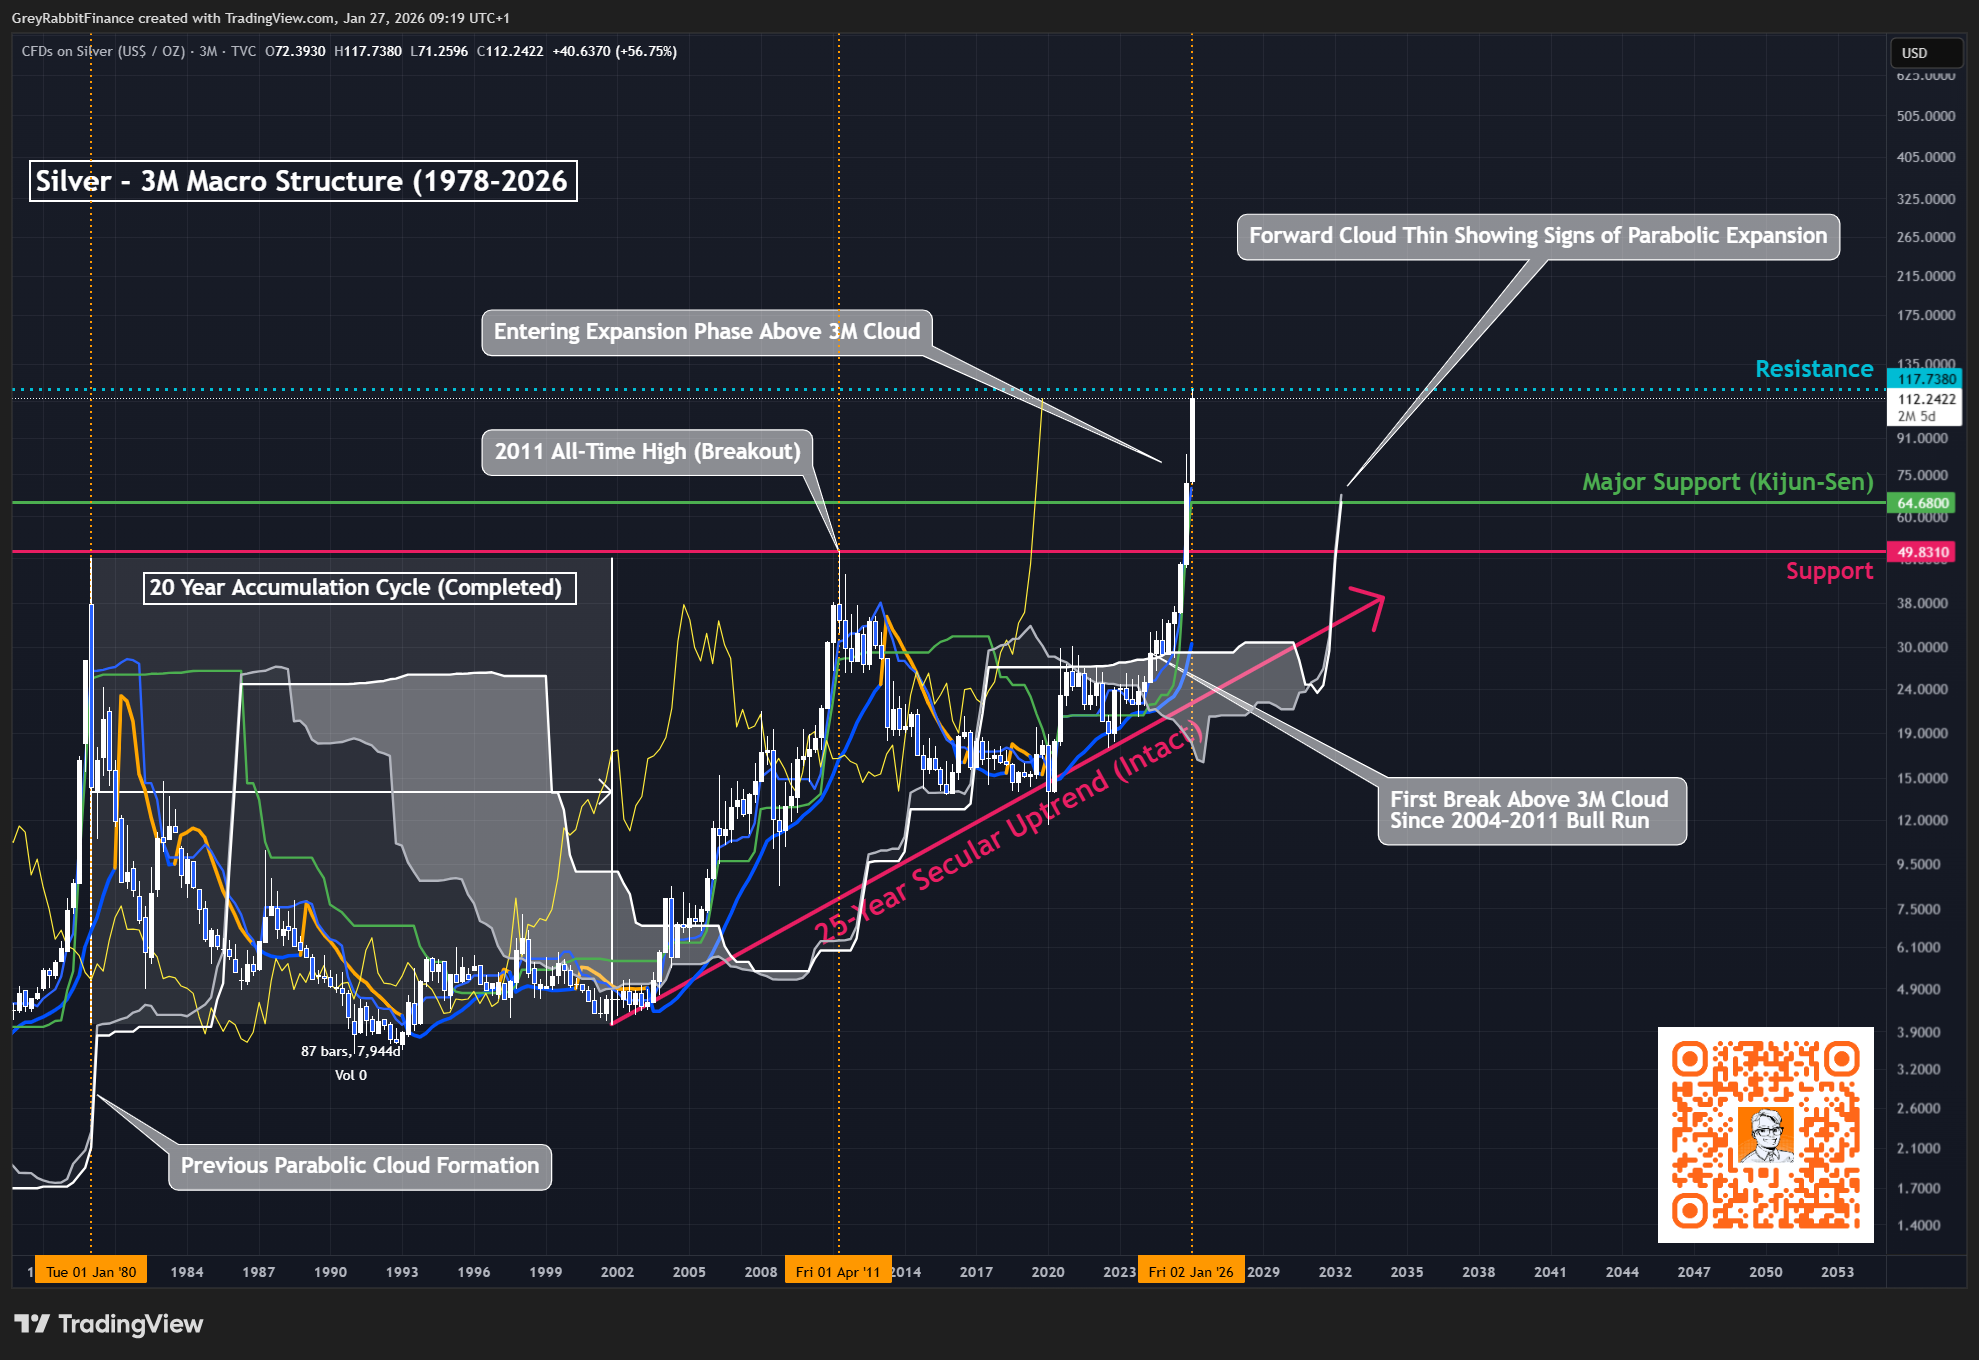
Silver’s 3-Month macro structure has officially entered its expansion phase for the first time since the 2004–2011 bull run. The 20-year accumulation cycle is complete, the 25-year secular uptrend remains intact, and price has now broken above the 3M cloud. Forward cloud thinning signals early parabolic conditions as we approach the 2026 cycle window.
🖼️ SILVER — Monthly Chart (2026 Macro Structure)
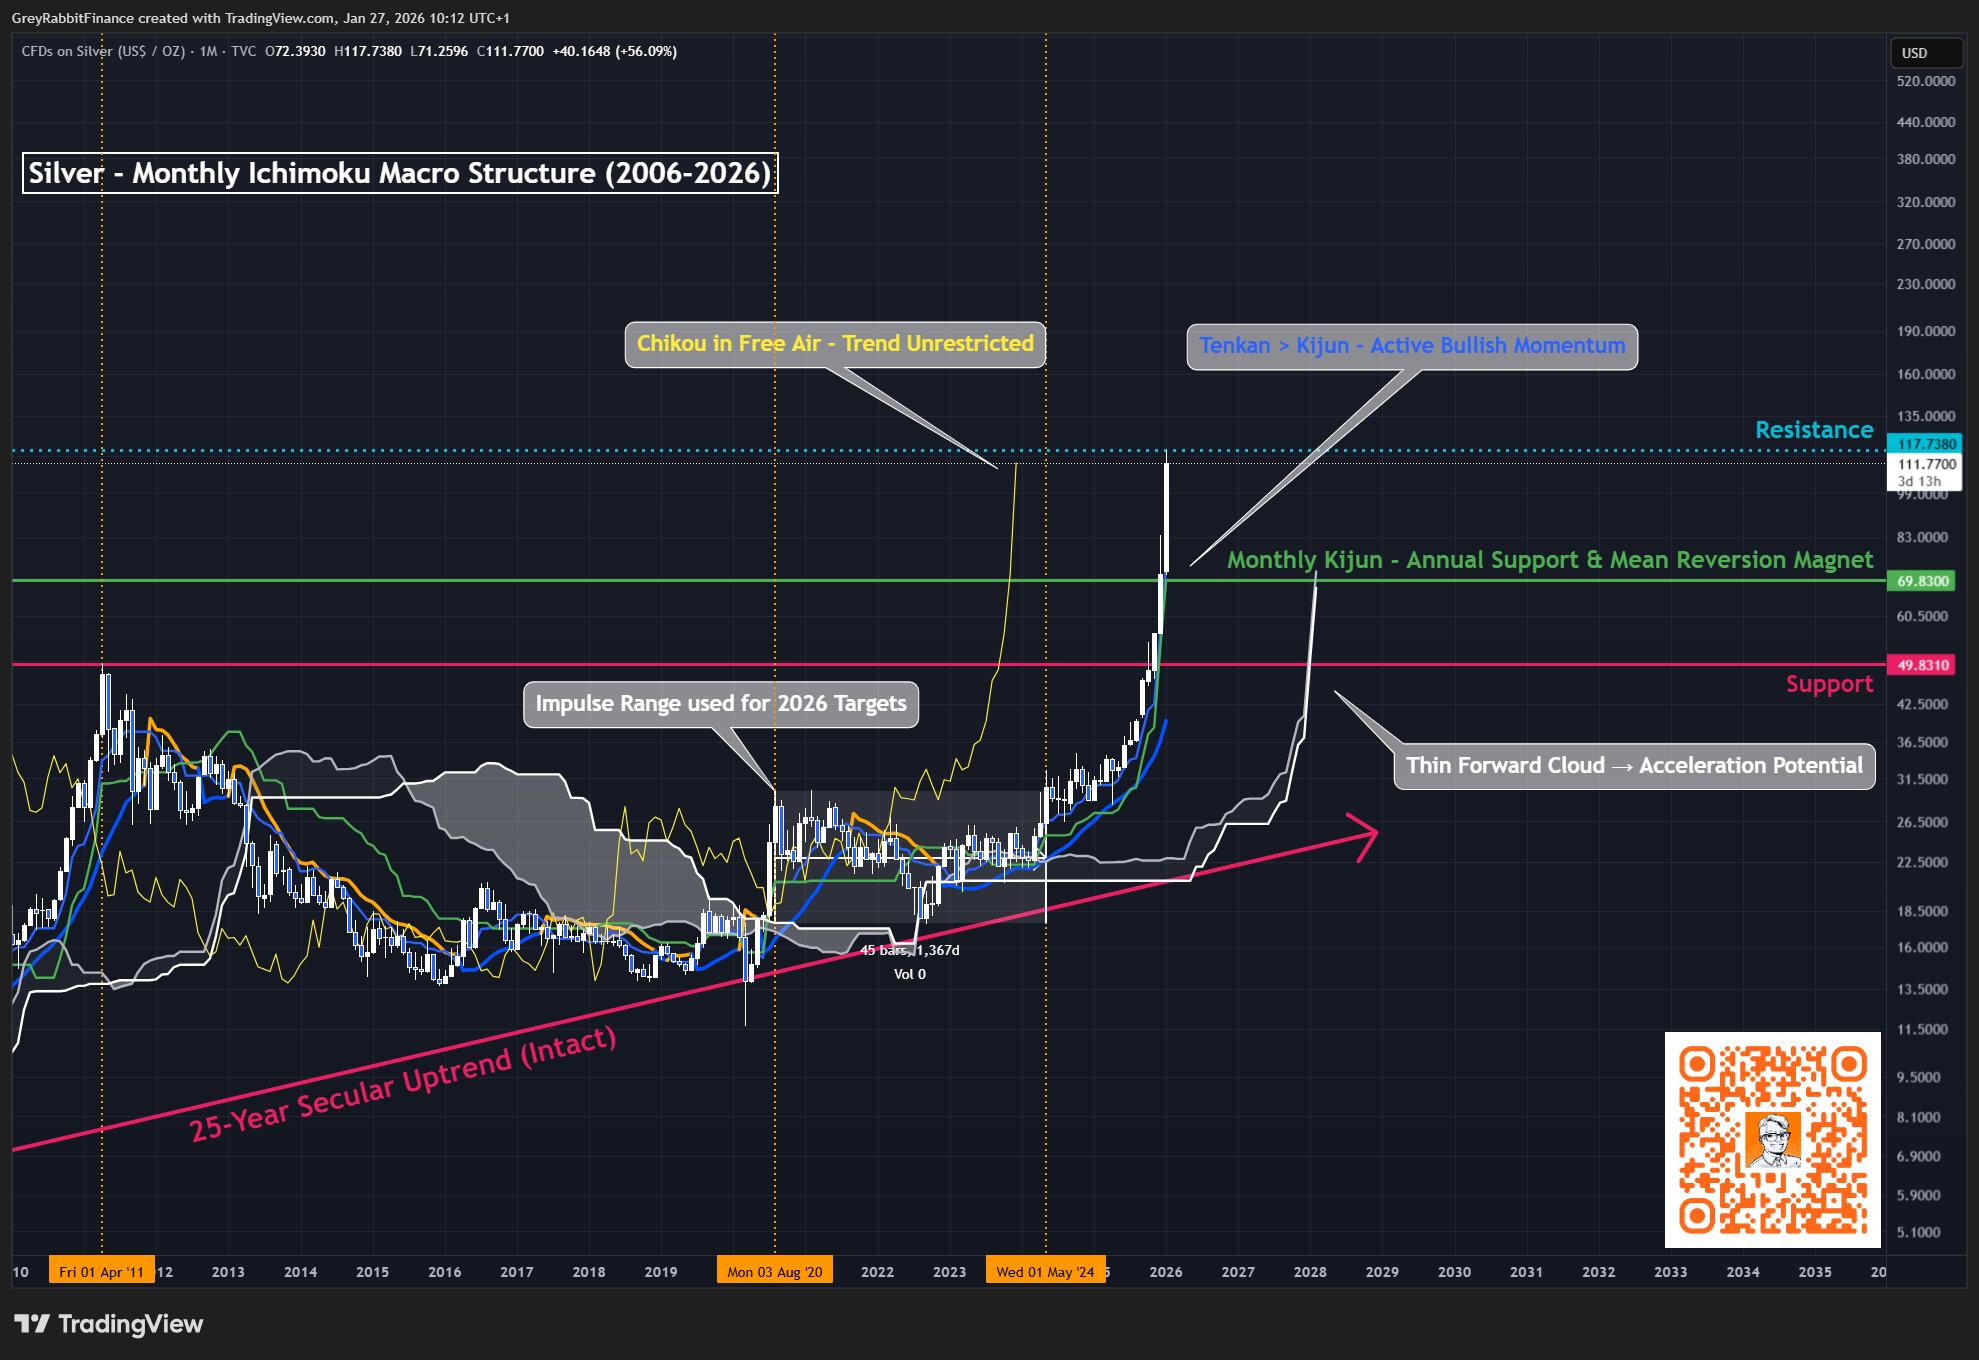
Price above the Monthly cloud, Tenkan > Kijun confirms active momentum, and the forward Kumo has thinned for the first time since the 2004–2011 bull market. Silver has fully transitioned into its expansion phase… this defines the 2026 baseline trend posture.
🖼️ SILVER— Weekly Chart (Trend Path & Pullback Zones)
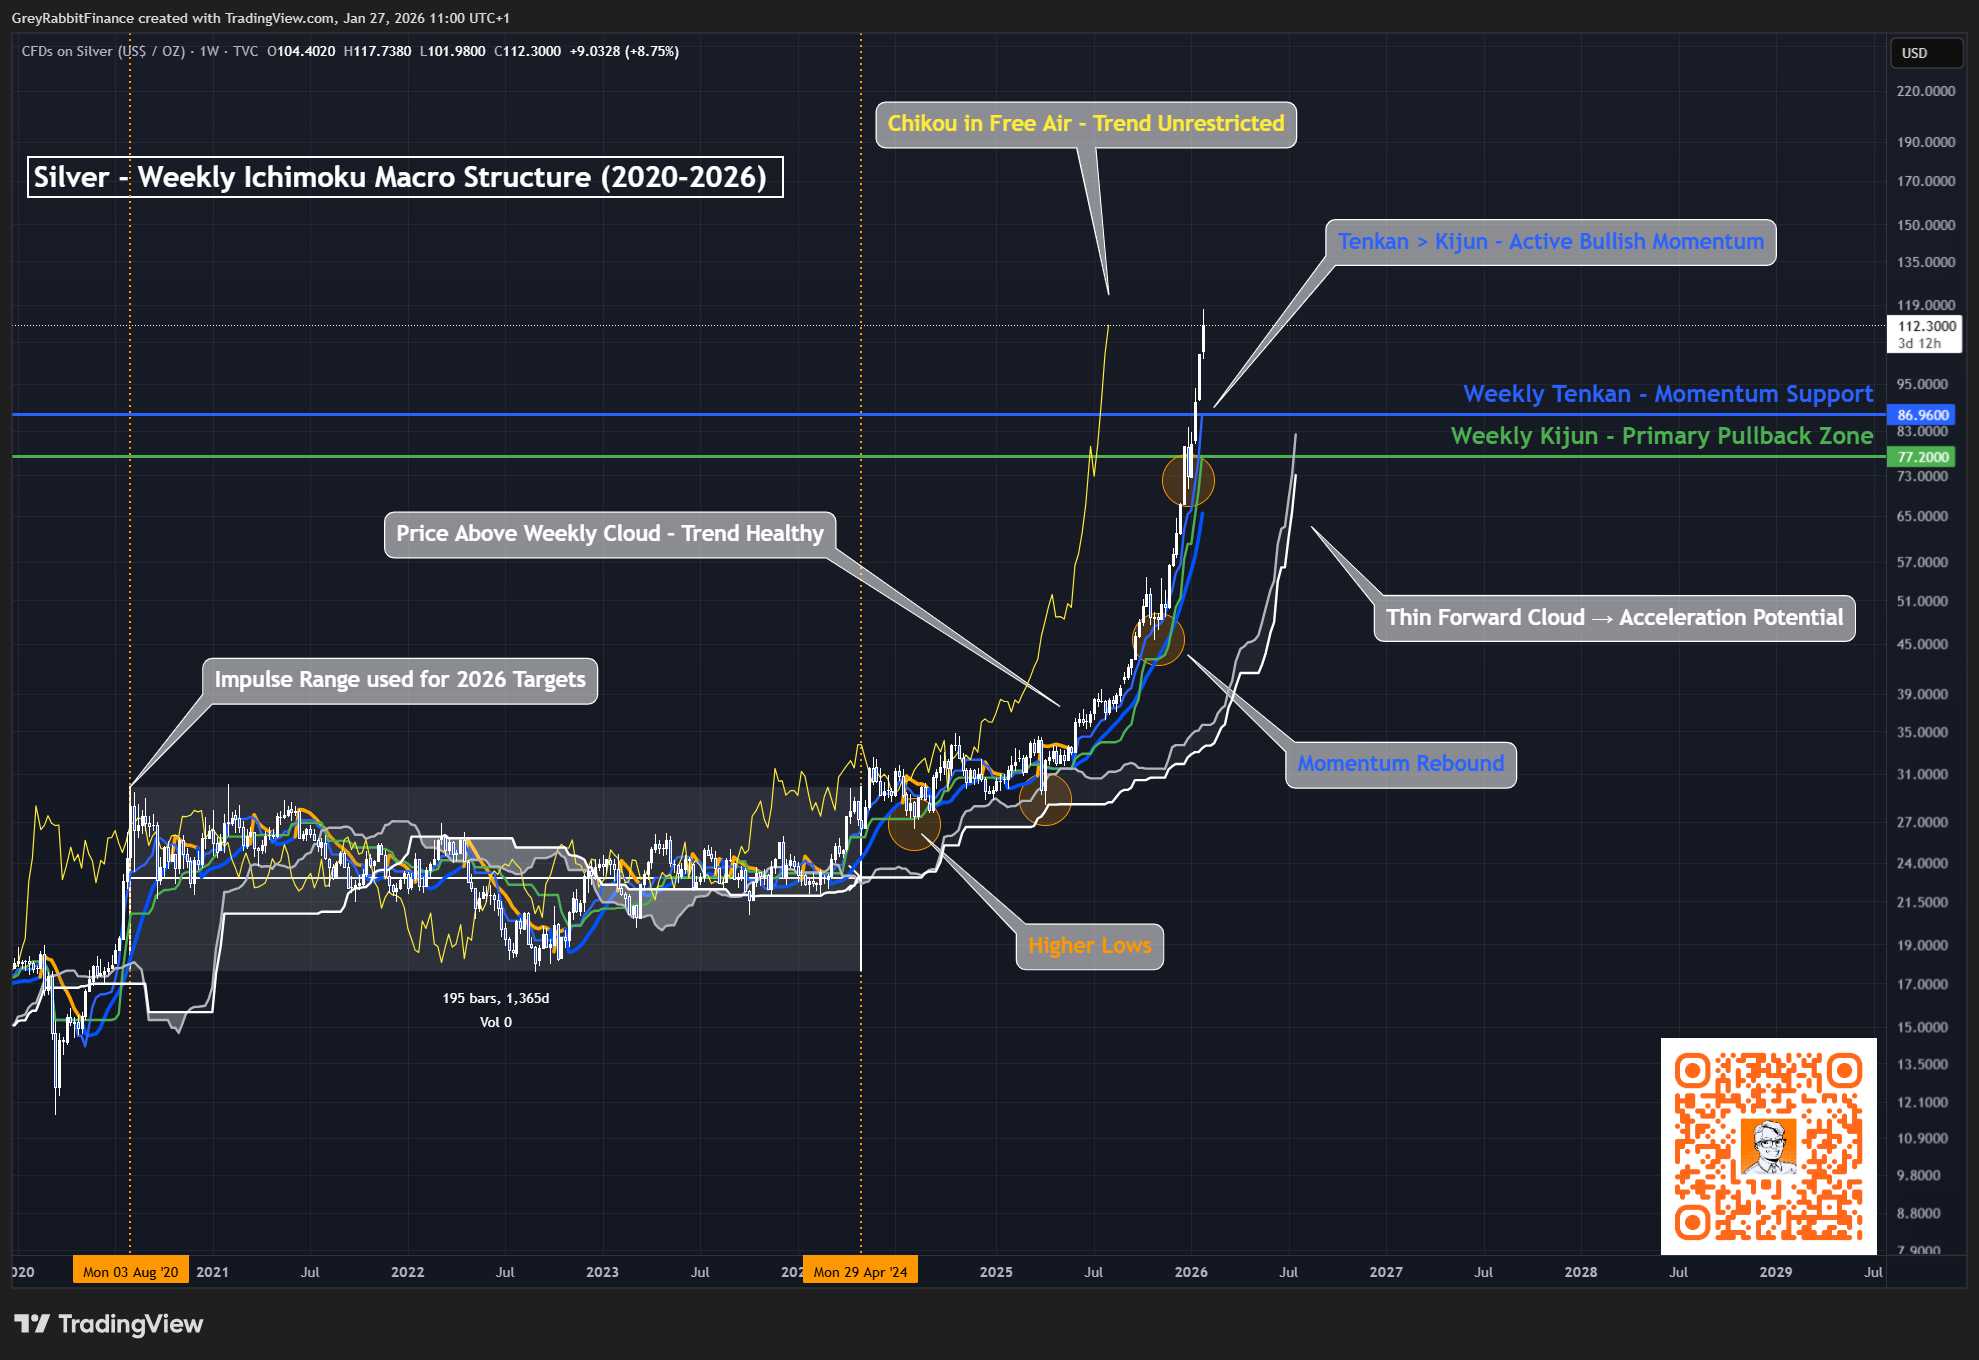
Price is firmly above the Weekly Cloud, Tenkan is acting as momentum support, Kijun defines the primary pullback zone, and the forward cloud is thinning sharply. Higher lows are forming faster, and Chikou is in free air… confirming that Silver has shifted into an early acceleration phase for 2026.
Across all high timeframes, Silver’s structure is identical to every prior pre-parabolic setup.
2️⃣ Market Regime — Expansion → Acceleration
Silver has now transitioned from expansion to acceleration… the phase where parabolic curvature begins.
The trigger?
A +315% nine-month run, historically marking the exact point where:
buying accelerates
pullbacks shorten
volatility compresses
monthly candles expand
This occurred in:
1979
2004–2011
2020
and now again in 2025
Across the 3M, 1M, and 1W charts, Ichimoku confirms:
Chikou in free air
Razor-thin forward cloud
Steepening Kijun
Vertical Tenkan
Higher lows forming faster
This is not a blow-off top.
This is the ignition phase of a parabola.
3️⃣ Range Expansion Framework (Impulse Geometry)
Silver never produced a meaningful swing-low reset in 2024–2025.
That means the entire 2020–2024 impulse becomes the governing structure for all 2026 projections.
From this impulse, the Fibonacci expansion model generates the key geometric zones for the year:
🟦 Base / Continuation Zone → 2.0–2.272
Where the trend maintains strong but orderly expansion.
🟩 Stretch / Acceleration Zone → 2.414–2.618
This is where the parabola opens and velocity increases sharply.
🟧 Mania / Euphoric Zone → 3.0–3.272
The terminal stage of a full parabolic cycle, characterized by vertical momentum and retail-driven extension.
These levels are not price targets — they are expansion zones, representing the geometric growth phases of a parabolic asset. They define the structural boundaries for Silver’s 2026 trajectory.
🔒 Premium Section — Full 2026 Price Map
To access the full Fibonacci expansion zones, Base/Stretch/Mania projections, Ichimoku confluence, and the full parabolic timing model… continue reading as a paid subscriber.
This is institutional-grade analysis.
I want my readers positioned ahead of the curve.
👉 Subscribe to unlock the full 2026 Price Map
