


Oil Surges, Gold Holds: Navigating War, Geopolitics, and Fed Pause – Macro Market Report
Key Charts: Oil, Gold, Silver, Miners, DXY, Bitcoin & Geopolitical Risks – What to Watch This Week


This past week, markets responded sharply to escalating geopolitical tensions and shifting macro signals. On June 13, Israel launched a surprise strike on more than 100 Iranian military and nuclear sites, triggering a major retaliation from Iran involving over 150 missiles and 100+ drones.
With fears mounting over a wider regional conflict—particularly disruptions to the Strait of Hormuz, which carries around 20% of global oil flows—Brent crude surged nearly 15%, jumping from $67 to nearly $78/bbl. Gold also rallied, climbing from $3,318 to a high of $3,346/oz, as safe-haven demand spiked.

At the same time, speculation around a ¥1.5–2 trillion (~$300 billion) Chinese stimulus package aimed at infrastructure and housing gave a strong bid to industrial metals and global miners. In Europe, the ECB’s June 5 rate cut (25 bps to 2.0%) continued to support risk assets. Meanwhile, in the U.S., a cooler-than-expected June 12 CPI print (0.2% MoM, 2.4% YoY) reinforced expectations that the Fed will stay on pause, triggering a rotation out of tech and into hard assets.
Looking ahead, this week brings several key economic events, including U.S. May retail sales, industrial production, and housing data, but all eyes will be on the FOMC meeting on June 18 — where interest rate decisions and Fed guidance will be the primary market mover. Global PMI prints and Fed speakers will also add important context as markets seek direction.
Let’s break it all down—charts, catalysts, how to trade the rotation, and what’s next.

📊 Key Charts:
US OIL (WTI - Daily Chart)
Ichimoku Lines: 5 Lines Pointing Up - Bullish
Ichimoku Cloud: Bullish Kumo Cloud (Still too thin)
Entry Zone: Pullback to support level at $69.
Catalyst Watch: Geopolitical Tensions (Israel/Iran), FOMC June 17th.
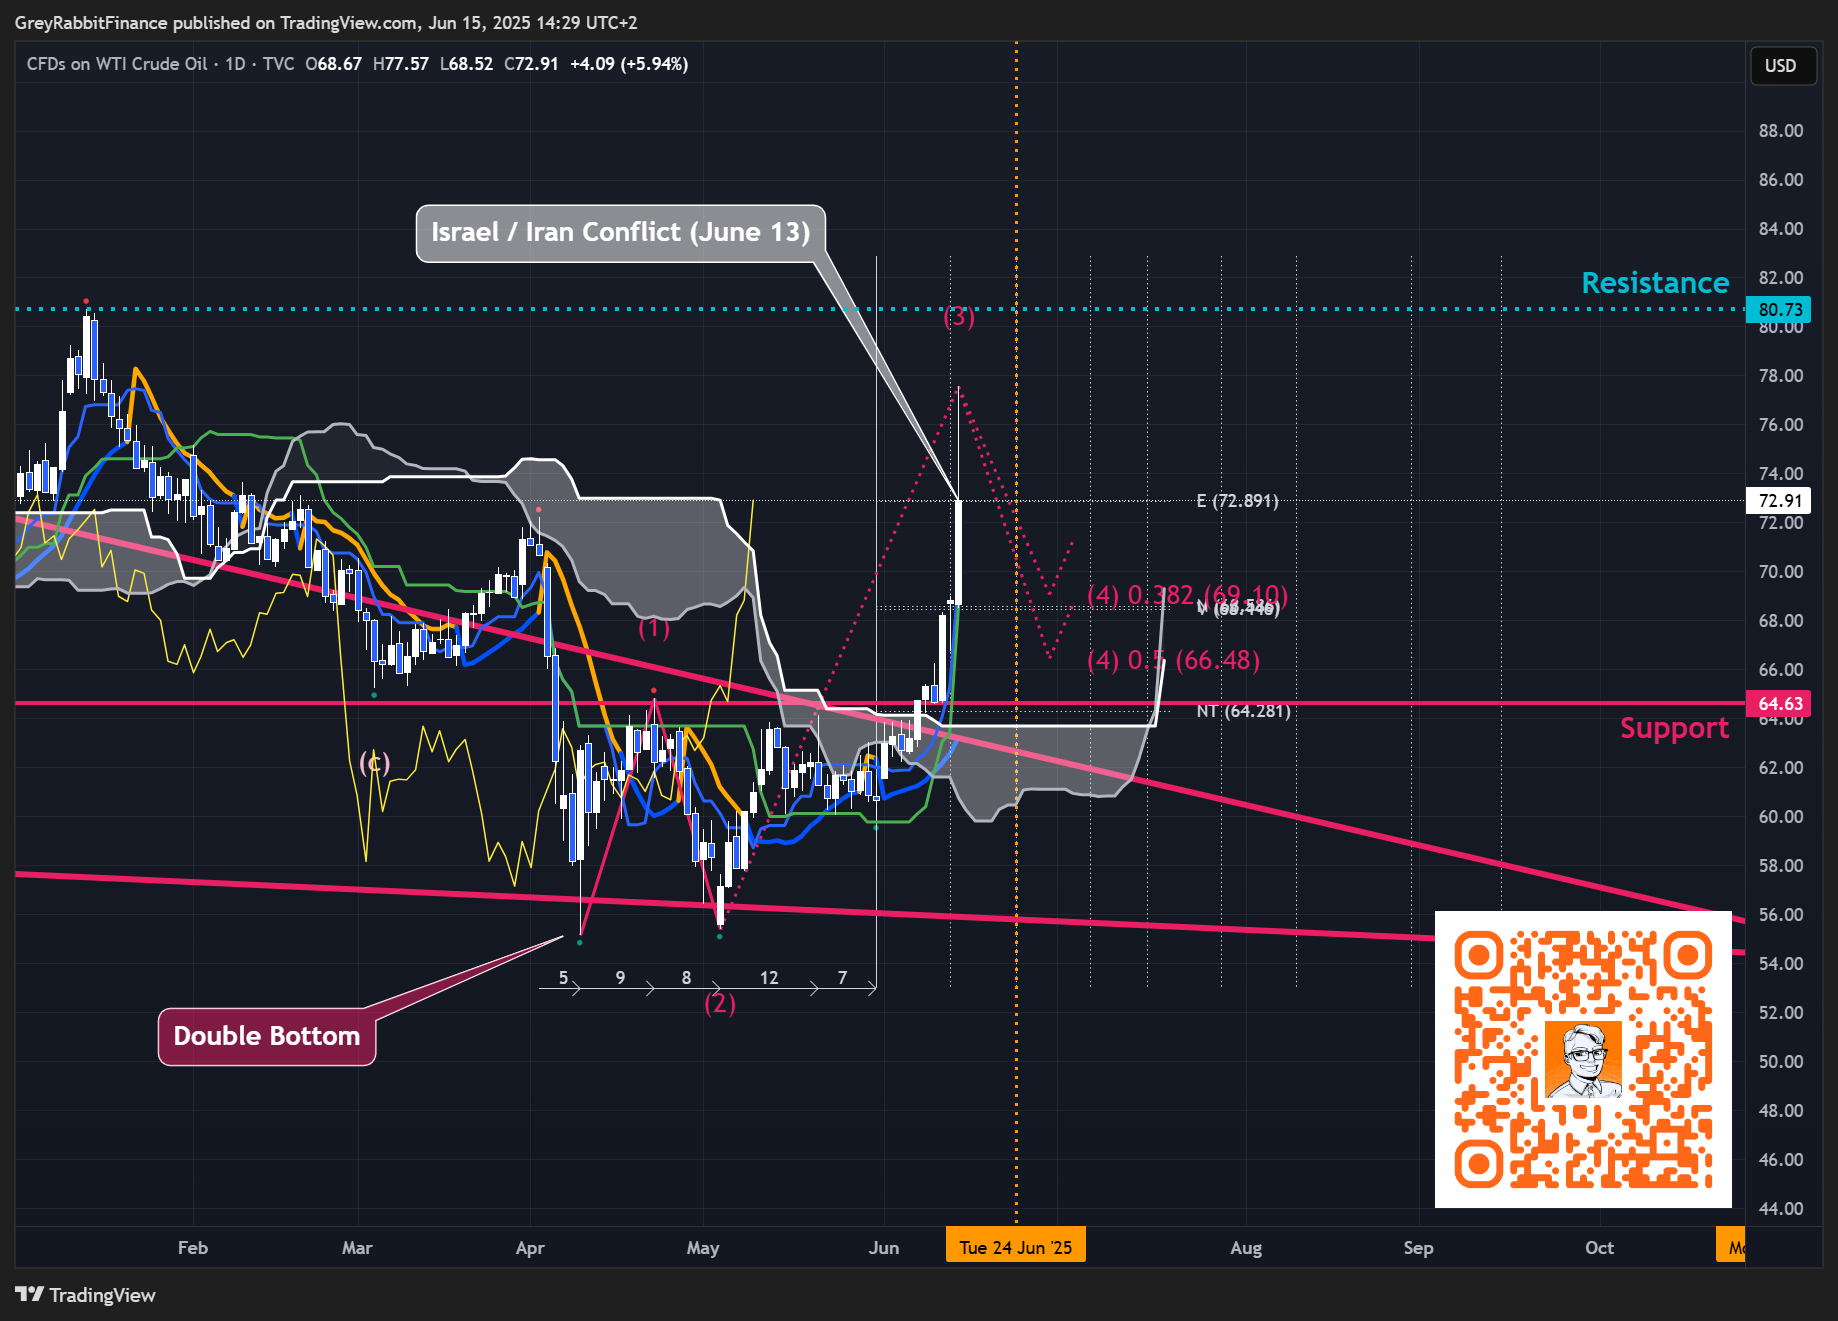
After trending lower since June 2022, Oil is now setting up for what could be a major reversal. As called out in last week’s macro market report, I’m starting to see Oil shaping up as an attractive long setup. The Daily Chart is has now turned bullish according to Ichimoku, we should look for a pullback to the $69. The next Henka-Bi Time period is (June 24), around this time we should have completed a pullback or continued impulse wave higher. Rising geopolitical tensions, the potential return of monetary easing, and a broader rotation into hard assets are all aligning to create a perfect storm. I am personally long Oil and looking to add more to my position on the next pullback.
Gold/USD (Daily Chart)
Ichimoku 5 Lines: 4 Up - Senkou Span B Flat
Ichimoku Cloud: Bullish Kumo Cloud
Entry Zone: Pullback to support level at $3120.
Catalyst Watch: Geopolitical Tensions (Israel/Iran), FOMC June 17th.

Gold remains in a bullish trend, currently consolidating after an impressive 28% year-to-date climb. If the price dips to around 3,120, I’ll be looking to add to my position. That level would represent a strong value opportunity, and I don’t expect it to stay there long given the likely surge in demand. If we retest the $3500, I will have to adjust those entry levels. Between now and our next Henka-bi time period (June 24) we should have enough information to determine the markets next direction/momentum. I am Long Gold, and will continue adding until the monetary system resets.

🔍 Market Lineup
S&P 500: Momentum fading near key resistance at 6,147, with recent price pullback below 6,000 signaling caution. Watch for potential double top formation in July.
Current Price: 5,976DXY (US Dollar Index): Retracement underway, with potential short-to-medium term bounce toward 101–103 levels as geopolitical tensions support safe-haven demand.
Current Price: 98.44Gold: Strong safe-haven demand amid war fears; consolidating near $3,433 with pullback entry zone around $3,120. Bullish trend intact, positioning for further upside.
Current Price: $3,433Silver: Breaking out on monthly charts, poised to reach Q2 target near $38 as industrial metals rally on Chinese stimulus speculation.
Current Price: $36.29Gold Miners (GDX): Monthly bullish trend confirmed. Expect potential pullback to $44.12 before next leg up toward targets above $57.
Current Price: $54.56Silver Miners (SLVP): Weekly bullish trend confirmed; watch for retracement to support near $16.28 as miners gain momentum alongside physical silver demand.
Current Price: $18.15Oil (WTI): Bullish daily trend confirmed; geopolitical tensions driving sharp price surge, currently testing $73 with pullback support near $69.
Current Price: $72.91 per barrelBitcoin: Testing resistance near $112,000; recent retracement healthy but watch for N-wave breakout close to confirm next leg higher.
Current Price: $105,677
Want the full annotated charts and setups? Or have a personal technical analysis request?
Keep reading with a 7-day free trial
Subscribe to Grey Rabbit Finance's Substack to keep reading this post and get 7 days of free access to the full post archives.