


📣 If this helped make sense of why markets are moving the way they are… share it.
Gold and Silver ETF Inflows Accelerate
Western investment demand for precious metals is returning. After months of persistent redemptions, GLD and SLV have attracted roughly $7.5 billion in combined net inflows since early August, marking a significant reversal in investor positioning.
ETF flows are particularly important because they translate financial-market demand into demand for underlying metal. During strong precious-metals cycles, rising prices can attract additional capital, expanding ETF holdings and reinforcing demand.
CHART: Gold Buoyed by ETF Inflow Momentum
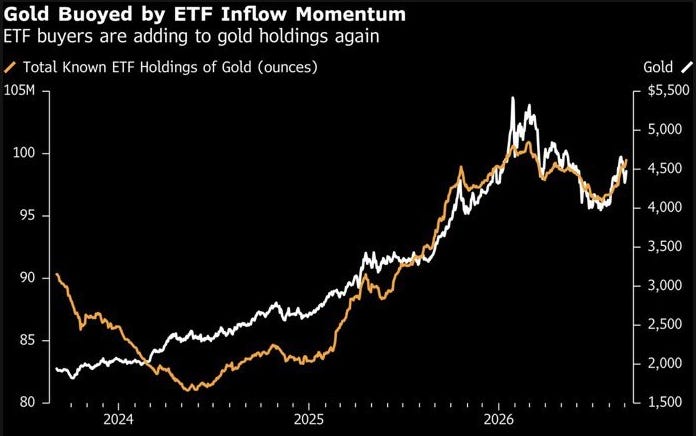
This bull market has already advanced substantially without the level of Western investment participation seen during previous precious-metals manias. Central banks and Asian physical demand drove much of the earlier move, while institutional and ETF capital are now becoming larger sources of demand.
Central-bank purchases also rebounded during the second quarter after slowing earlier in the year. That structural demand has helped gold remain remarkably resilient despite elevated real interest rates.
CHART: Central Bank Buying Insulates Gold From Higher Real Yields
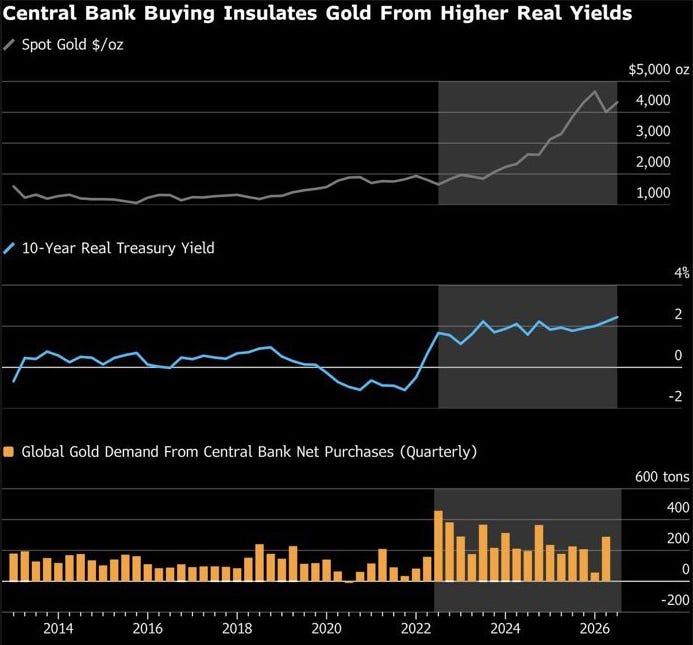
Historically, rising real yields represented a major headwind for gold because they increased the opportunity cost of holding a non-yielding asset. That relationship has weakened considerably since central-bank gold purchases accelerated around 2022.
Central banks are increasingly accumulating gold for reserve diversification, geopolitical protection and reduced dependence on foreign sovereign debt, creating a source of demand that is less sensitive to short-term interest rates.
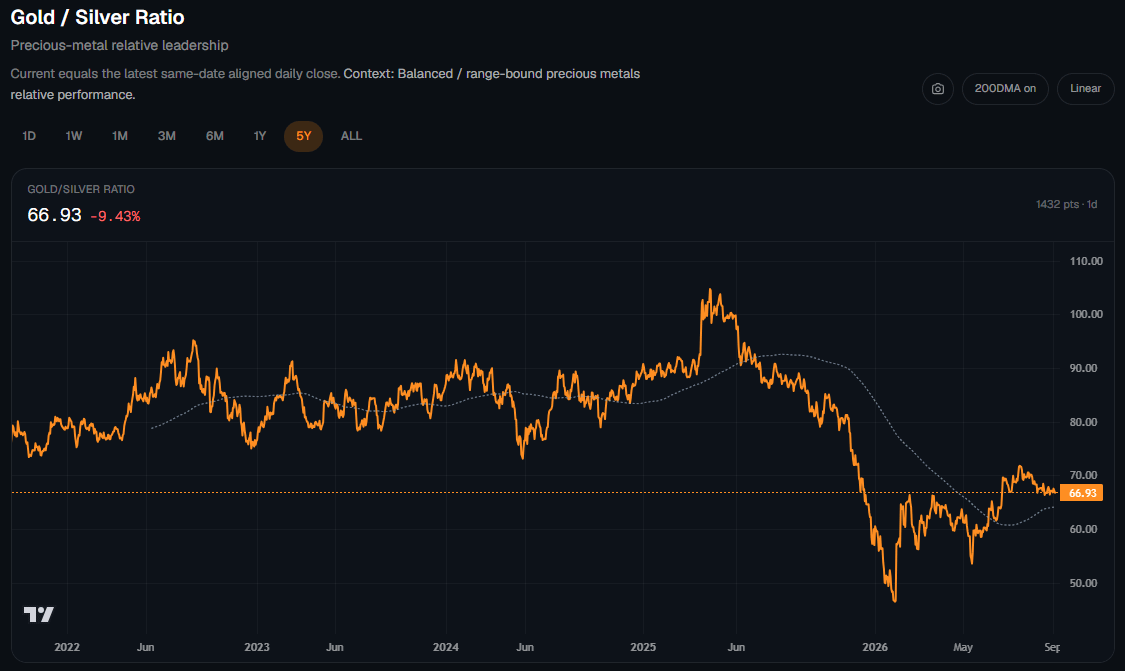
Silver remains leveraged to the broader precious-metals cycle. After collapsing from above 100 in 2025 to below 50 earlier this year, the gold-to-silver ratio has recovered to roughly 67 and is now trading near its 200-day moving average.
The rebound reflects gold’s relative outperformance during the recent metals correction, but the ratio remains well below the extremes reached before silver’s major 2025 advance.
CHART: Gold/Silver Ratio Back Near Historical Average
I continue to believe this bull market has not reached its final speculative phase. Central banks dominated the early stages, institutional investors and ETFs are increasingly participating now, and widespread retail mania remains largely absent.
India Defends the Rupee as Modi Takes Aim at Gold
The Reserve Bank of India continues to sell U.S. dollars to support the rupee, with intervention through state-run banks helping stabilize the currency despite elevated oil prices and pressure across Asian currencies.
Sustained intervention can eventually affect bond markets because central-bank reserves are not simply piles of cash. A large portion of global foreign-exchange reserves is invested in liquid securities, including U.S. Treasuries, which can be sold when central banks require additional dollars for intervention.
Prime Minister Narendra Modi has also urged Indians to reduce purchases of imported goods, including gold, as the government attempts to reduce foreign-exchange outflows.
India is one of the world’s largest gold consumers but relies heavily on imports to satisfy domestic demand. The country has faced this problem before.
Gold-control measures were introduced in 1963 as the government attempted to conserve scarce foreign exchange. Restrictions were progressively tightened during the currency problems of the 1960s, culminating in severe restrictions on private ownership of primary gold and the Gold (Control) Act of 1968.
Those controls failed to eliminate India’s appetite for gold. They instead encouraged smuggling and pushed significant portions of the trade underground while Indian households continued to accumulate the metal.
More than half a century later, the monetary tension is familiar: the RBI is selling dollars to defend the rupee while the government is asking Indian households to buy less gold.
The effort is already struggling. Indian gold demand has remained resilient despite Modi’s appeal, with jewelry sales continuing to benefit from religious festivals, weddings and gold’s role as a household store of wealth.
I don’t expect this campaign to work either. India’s most important seasonal period for physical gold demand is approaching.
Dhanteras begins the Diwali festival period on November 6, with Diwali itself falling on Sunday, November 8 this year. Dhanteras is particularly important for precious metals because buying gold and silver is traditionally considered auspicious.
That is followed by India’s broader wedding season, another major source of jewelry and physical gold demand.
After high prices constrained purchases during parts of the year, I expect Indian buyers to return with a vengeance as Diwali and wedding-season demand builds.
Governments can influence taxes, imports and access to gold. Changing India’s centuries-old preference for owning it has historically proven much more difficult.
Japan Sells Foreign Securities to Defend the Yen
Japan appears to have tapped its enormous foreign reserves to finance its record intervention in support of the yen.
Japan’s foreign reserves fell by a record $79.6 billion in August to $1.208 trillion, while authorities conducted a record ¥15.4 trillion ($98.7 billion) of currency intervention between July 30 and August 26. The decline was concentrated in foreign securities, which are held largely in U.S. Treasuries and account for roughly 70% of Japan’s reserves.
CHART: Japan’s Foreign Reserves / Foreign Securities — August Intervention
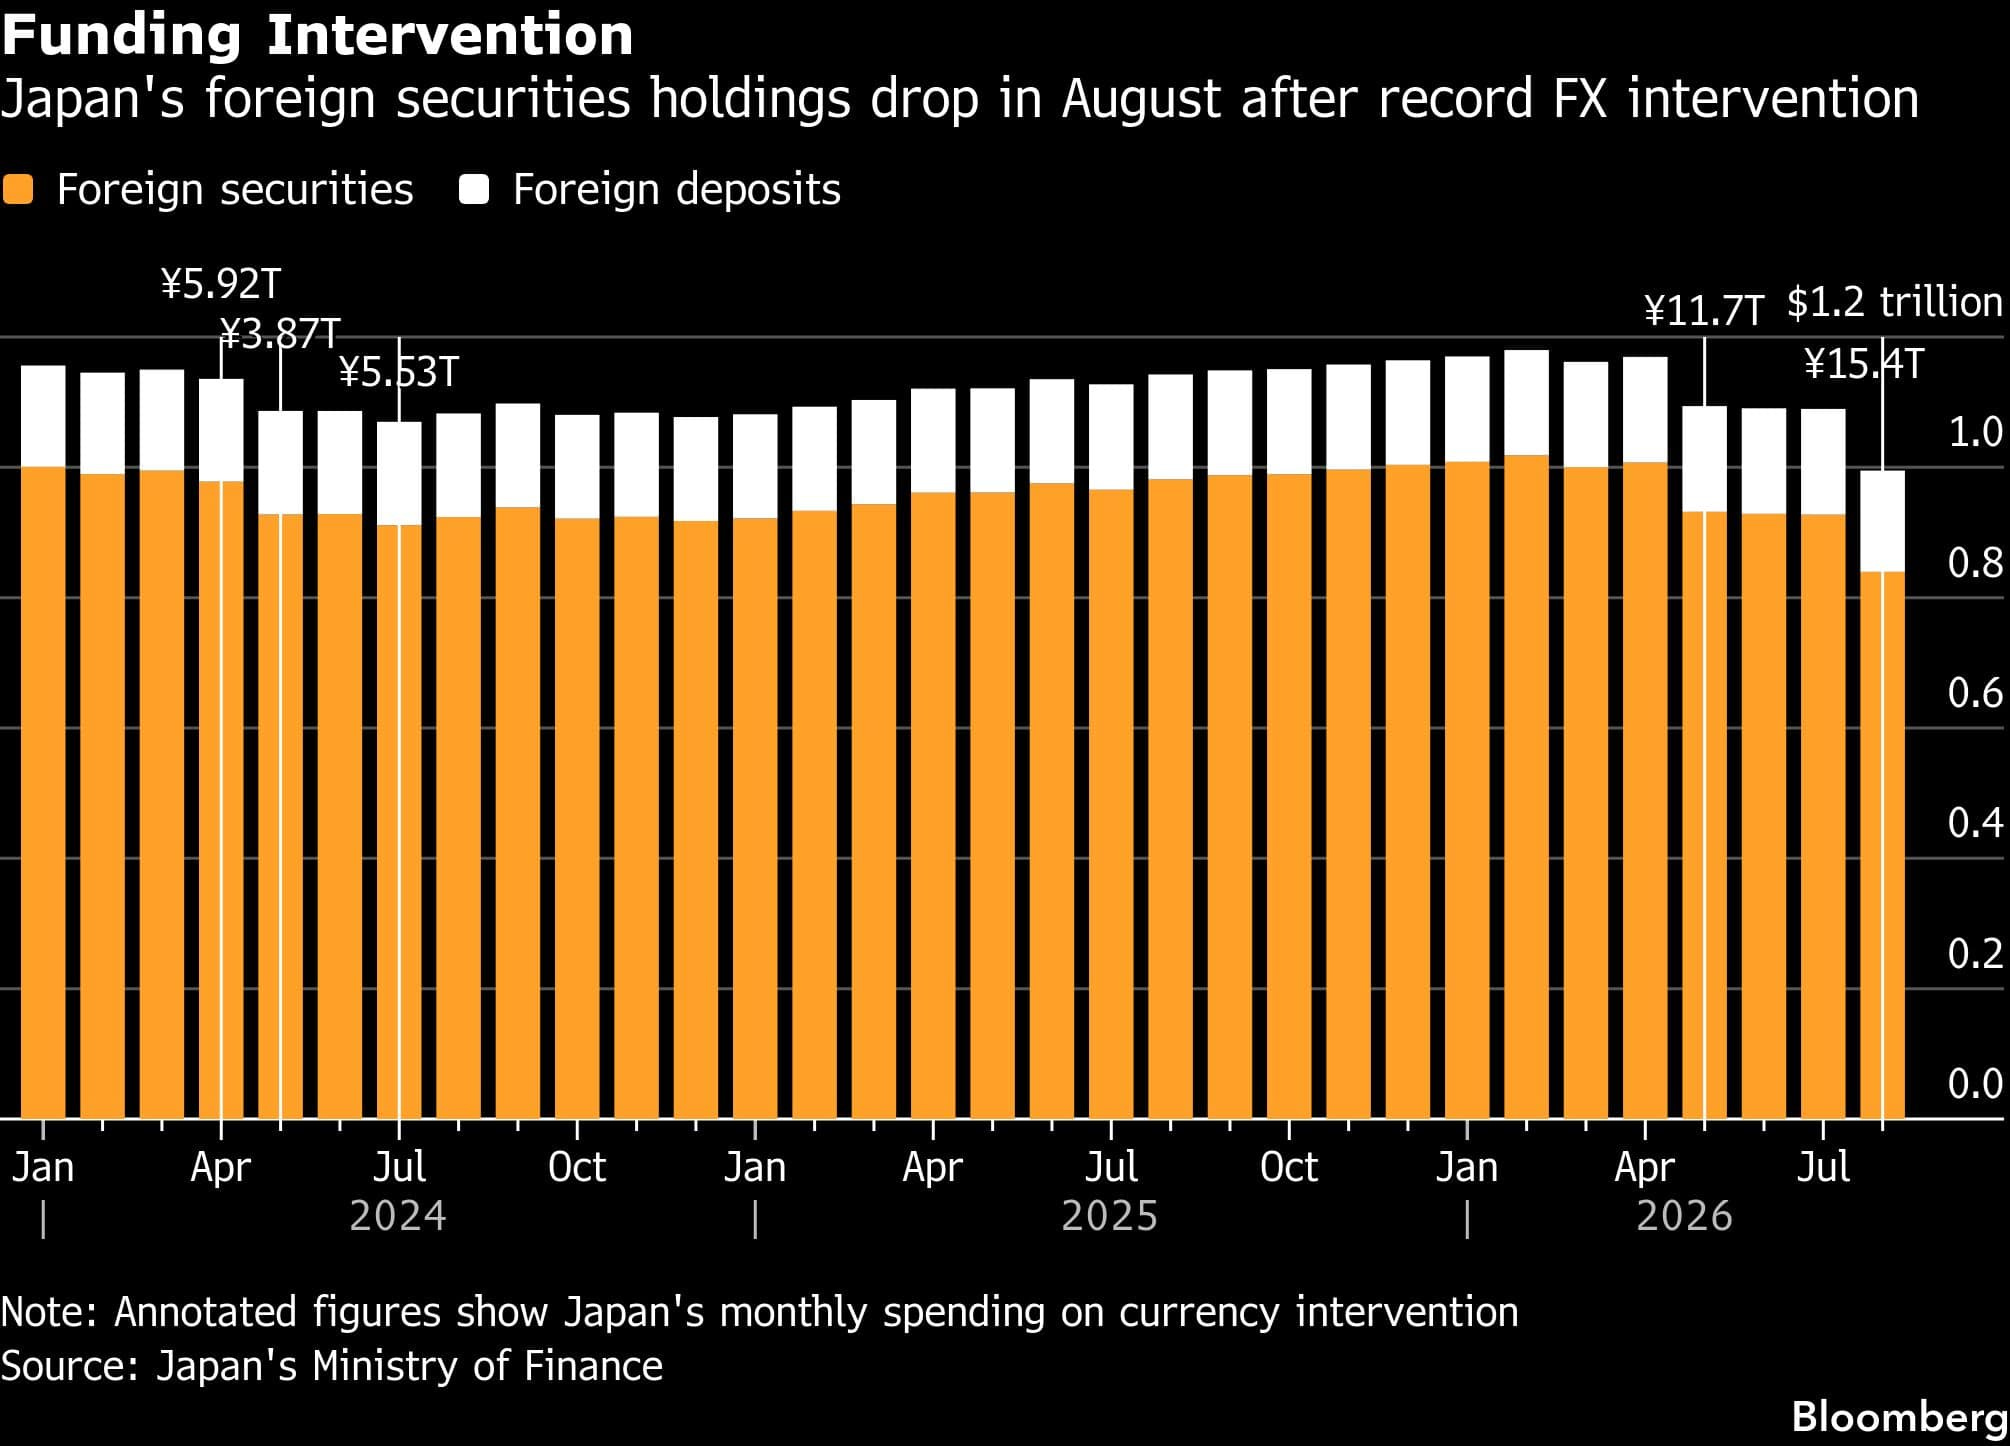
Japan’s foreign-security holdings fell by a record $87.8 billion in August, from $927.3 billion to $839.6 billion, broadly matching the scale of Tokyo’s record intervention to support the yen.
Japan is one of the world’s largest foreign holders of U.S. government debt and has historically accumulated Treasuries through its management of foreign-exchange reserves. Bloomberg reports that Japan likely sold a portion of those securities, including U.S. Treasuries, to finance the latest intervention.
Further intervention could therefore add another source of Treasury selling at a time when the United States is already financing large fiscal deficits through heavy debt issuance.
Japan also has access to a Federal Reserve dollar-liquidity facility that could provide dollars against Treasury collateral, reducing the need to sell those securities outright during future intervention. That makes Treasury liquidation a potential consequence of intervention rather than an automatic one.
For gold, the broader trend remains important. Major foreign reserve holders are increasingly being forced to balance currency stability against their holdings of foreign sovereign debt, while gold remains a reserve asset with no corresponding counterparty liability.
🔑 Key Market Themes & Weekly Asset Movements
(Opening Price as of September 7th, 2026)
S&P 500 (SPY): $770.19
DXY: 99.43
WTI Crude Oil: $84.69/bbl
Bitcoin: $77,659
Gold: $4,427/oz
Silver: $66.11/oz
Platinum: $66.11/oz
GDX: $99.26
GDXJ: $129.03
SIL: $99.29
SILJ: $31.68
🗓️ Economic Calendar — Key Events This Week
1. Japan GDP (Monday)
Japan releases Q2 GDP at 7:50 PM ET, providing an updated look at growth as policymakers contend with renewed pressure on the yen.
2. China CPI & Bank of England Hearings (Tuesday)
China reports August CPI at 9:30 PM ET, with inflation providing another read on domestic demand and the strength of China’s recovery. Earlier, the Bank of England’s Monetary Policy Report hearings begin at 9:15 AM ET.
3. Lagarde Speech (Wednesday)
The calendar is relatively light Wednesday, with ECB President Christine Lagarde speaking at 1:00 PM ET ahead of Thursday’s policy decision.
4. ECB Rate Decision (Thursday)
The European Central Bank takes center stage Thursday. The rate decision and monetary-policy statement arrive at 8:15 AM ET, followed by the ECB press conference at 8:45 AM ET.
Markets will focus on the ECB’s guidance for inflation and future policy, with any shift in the expected rate path potentially affecting the euro, DXY and global bond yields.
U.S. August PPI also arrives at 8:30 AM ET, providing the first major U.S. inflation release of the week.
5. U.S. CPI & Consumer Sentiment (Friday)
Friday is the main event for U.S. markets. August CPI arrives at 8:30 AM ET, with headline inflation previously at 3.4% YoY and core inflation at 2.5% YoY.
Preliminary University of Michigan Consumer Sentiment follows at 10:00 AM ET, including closely watched consumer inflation expectations.
Bottom Line
Inflation and central banks take center stage this week. Thursday’s ECB decision and U.S. PPI set up Friday’s CPI report, which should be the week’s most important catalyst for U.S. markets.
For precious metals, the reaction in Treasury yields and DXY will be particularly important, especially as markets reassess the Fed’s rate path following the inflation data.

📊 Featured Chart Breakdown
Silver/USD (Daily Chart)
Trend: Bullish Recovery
Major Resistance: 71.55
Immediate Support: 65.48
Retracement Support: 64.14 → 62.14
Major Structural Support: 54.78
Current Price: 65.48
Upside Target: 73.27
Timing Watch: September 16 Henka-Bi
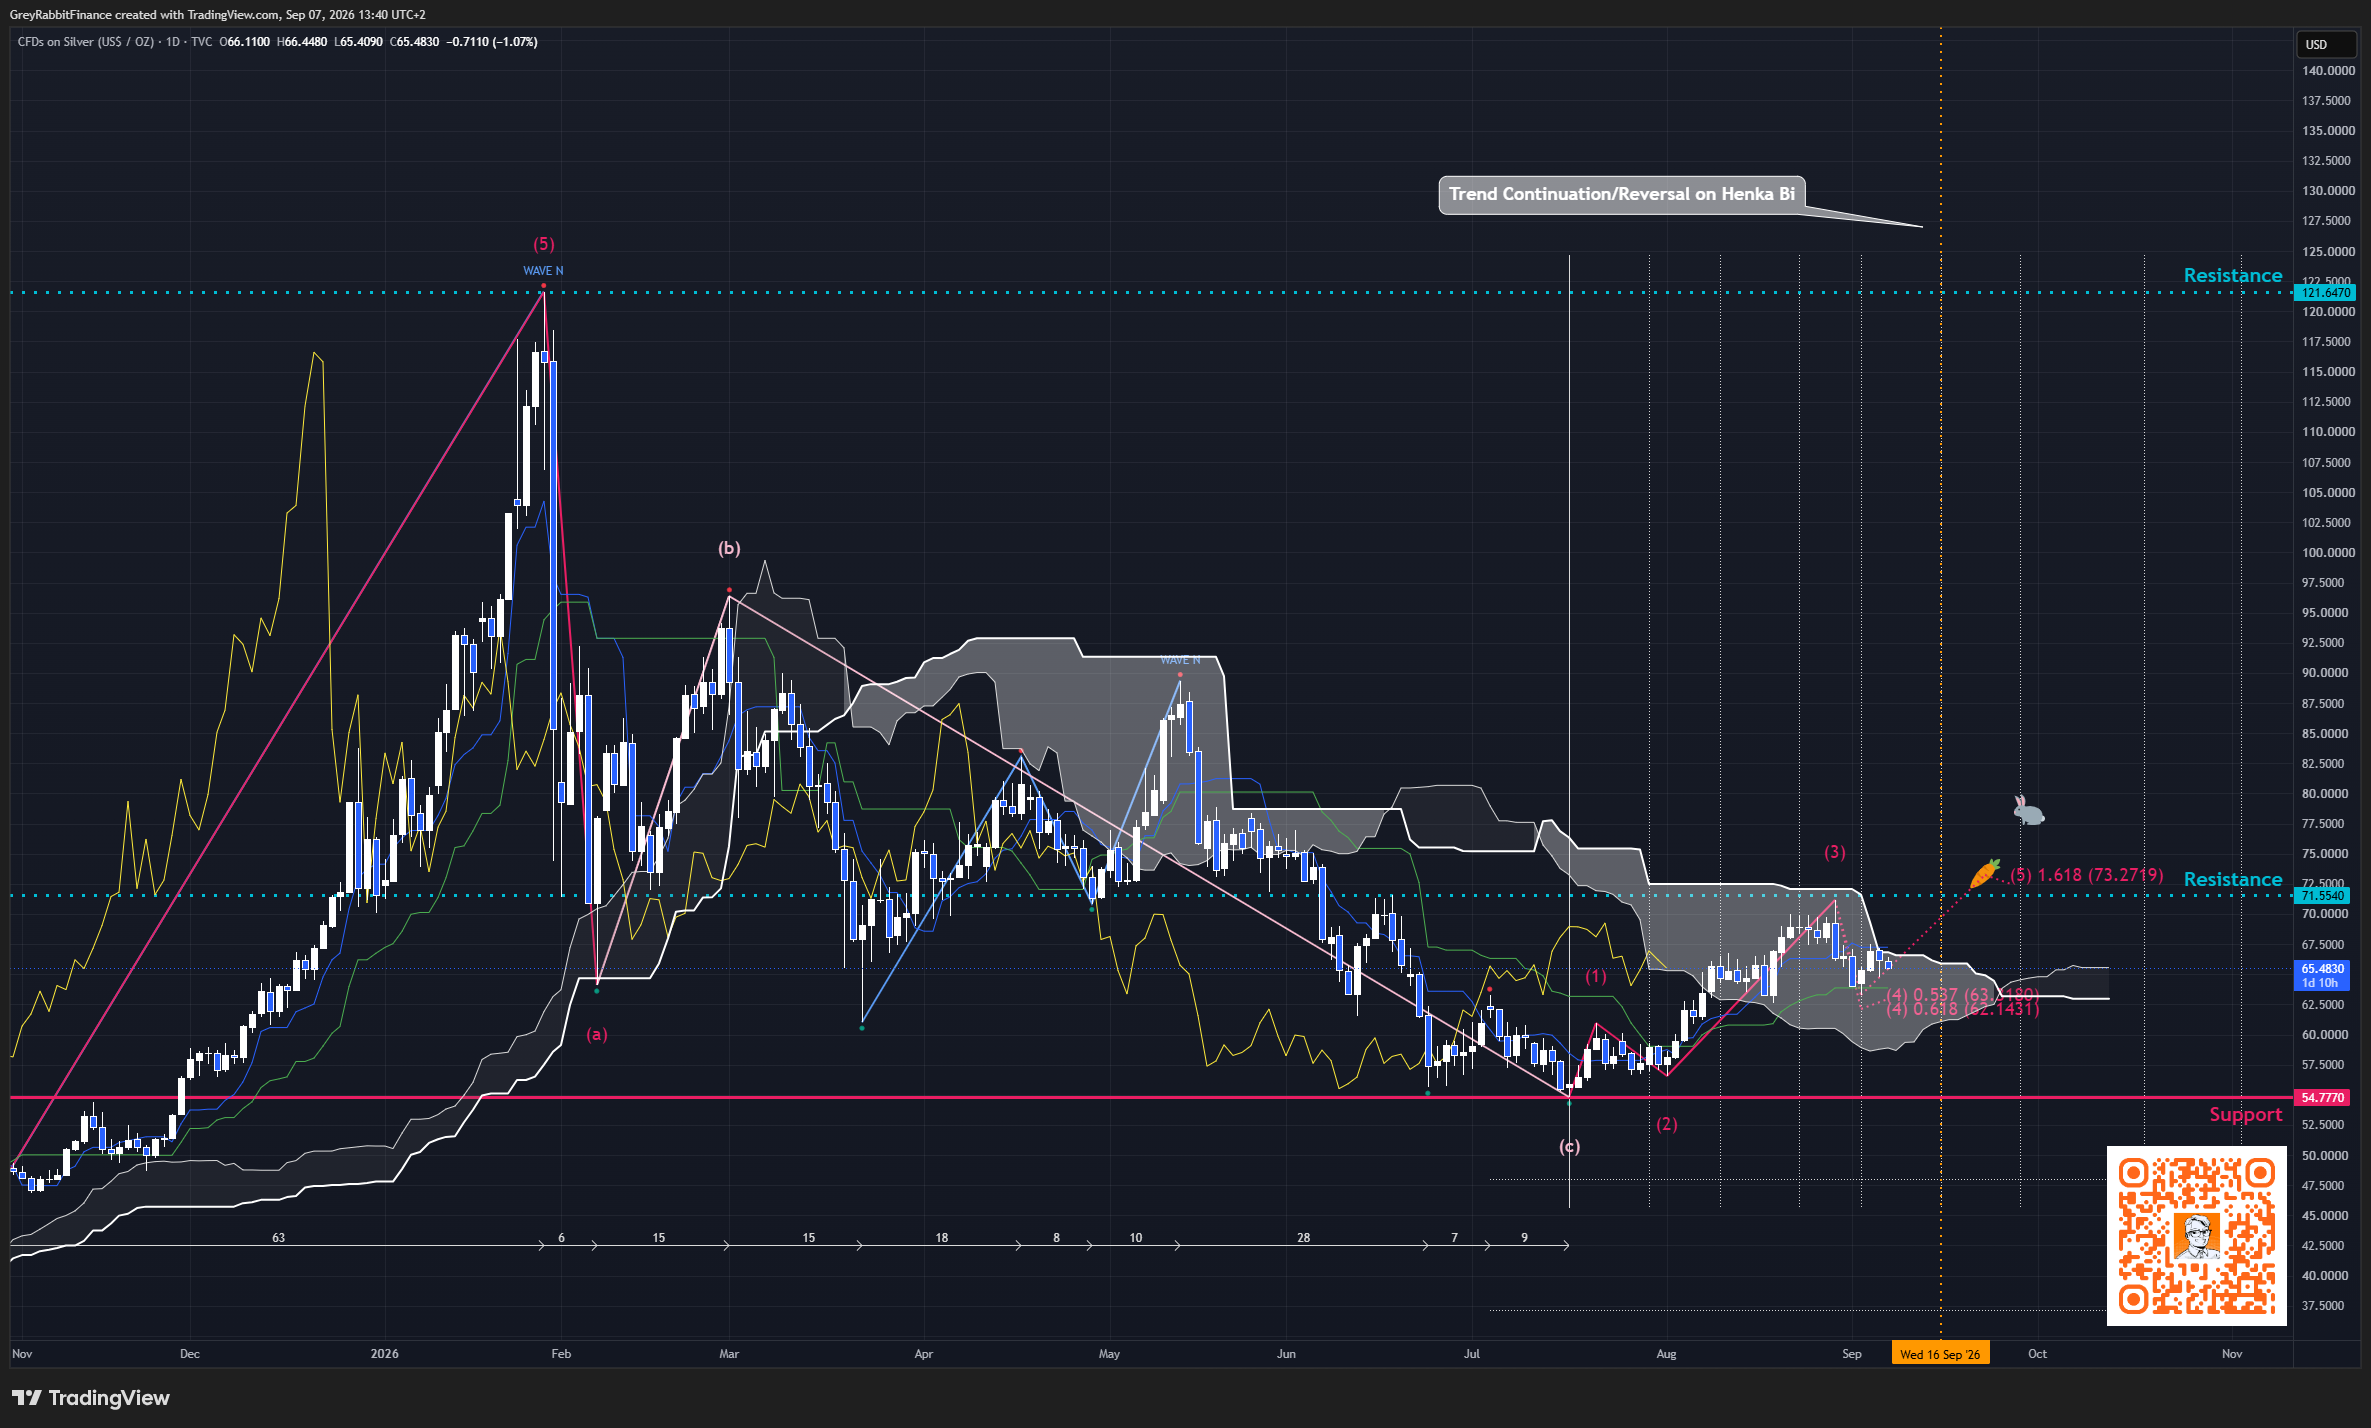
Silver’s broader recovery remains constructive, although price has pulled back from the recent test of $71.55 resistance and is now trading around $65.48.
The $71.55 level remains the key upside barrier. Silver tested this area during the latest advance but failed to produce a sustained breakout, sending price back toward the cloud and short-term support.
The immediate area I am watching is $65.48, followed by the retracement zone around $64.14 to $62.14. Holding this region would preserve the broader recovery structure and leave silver positioned for another attempt at resistance.
A sustained break above $71.55 would confirm renewed upside momentum and bring the next extension target near $73.27 into focus. A failure to hold the current support zone would weaken the near-term setup, although major structural support remains considerably lower at $54.78.
The next major Henka-Bi arrives September 16, creating another potential timing window for either trend continuation or reversal.
For now, silver remains in a bullish recovery structure, but $71.55 is still the level that must be cleared to confirm the next leg higher.
Looking to Own Physical Gold or Silver?
I’ve partnered with Noble Gold Investments to give Grey Rabbit readers a trusted option for adding physical precious metals to their portfolio.
→ Explore Gold & Silver with Noble Gold
Affiliate disclosure: Grey Rabbit Finance may earn a commission if you become a Noble Gold customer through this link.
💡 New to Ichimoku?
Grab my audio & eBook “At One Glance: Master the Ichimoku…” — it breaks down my charting method with real examples and setup logic.

🔒 Premium Analysis
👇 What’s behind the paywall:
✅ Full Ichimoku chartbook: BTC, SP500, Gold, Silver, Oil, GDX, SLVP, DXY
✅ Key support/resistance zones + Henka-Bi Time Cycle Windows
✅ Actionable trade plans and targets
✅ Weekly macro catalyst watch
