
China Steps Back, War Drums Build, Bad Bunny Signals – Macro Market Report
Key Charts: Stocks, Oil, Gold, Silver, Miners, DXY, and Bitcoin — What to Watch This Week


📣 If this helped make sense of why markets are moving the way they are… share it.
🌎 Big Picture
The world doesn’t shift all at once. It shifts in moments… unexpected, seemingly unrelated, but with a common undercurrent you only see in hindsight.
One of those moments just happened.
On Sunday night, the biggest stage on the planet was not Wall Street.
It was the Super Bowl field… where Bad Bunny walked out not with a pop hit or a pyrotechnic spectacle, but with culture, identity, history, and hard-money symbolism embedded into the backdrop of America’s most-watched event.
While millions of viewers danced and roared, a message was broadcast not through words, but through scene, context, and symbolism… a subtle signature of something larger rippling through the global psyche.
And that cultural hook fits perfectly beneath the surface of four far more consequential macro forces:
China stepping back from the bedrock of global liquidity — U.S. Treasuries
A U.S. military airlift on a scale not seen since Desert Storm
A historic political realignment in Japan
The reappearance of hard money imagery on the most watched stage in the world
These aren’t separate stories.
They are different facets of a singular macro transition:
trust in financial US dominance is slipping
geopolitical risk is rising
and the instinctual preference for hard assets… both economically and culturally… is re-emerging.
This is the beginning cadence of a new macro movement… one that will define price, policy, and positioning for the coming quarters.
Below are the stories that make up this week’s mosaic.
1. China Quietly Steps Back From U.S. Treasuries
Chinese regulators advised domestic banks to limit new purchases of U.S. Treasuries and pare down high-exposure positions, citing “concentration risk.”
Importantly, this guidance does not apply to China’s state-level Treasury holdings… which means this isn’t reserve policy. It’s strategic liquidity positioning.
What this really signals:
Foreign demand for U.S. debt is eroding
Volatility around Treasury auctions will increase
China is preparing for geopolitical instability
Hard assets benefit when sovereign demand shifts at the margins
The message is subtle but unmistakable:
China won’t be the marginal buyer of U.S. deficits in 2026.
And the bond market must find a new equilibrium without them.
This is how global monetary transitions begin… not with a bang, but with a small regulatory directive.
2. 112 USAF C-17 Aircraft Move Toward the Middle East
More than 112 C-17 Globemaster transport aircraft were tracked heading toward Europe and the Middle East… a logistical surge at Desert Storm levels.
This is not routine rotation.
This is pre-positioning.
Markets know the sequence:
Crude oil absorbs geopolitical premium
Volatility increases
Risk assets soften
Safe-haven flows rotate toward gold
Treasury markets strain under the weight of simultaneous liquidity and geopolitical shocks
A world drifting toward conflict is a world where real assets rise and financial assets wobble.
This airlift is a signal:
U.S. foreign policy is preparing for escalation, not de-escalation.
3. Japan Delivers Its Biggest Post-War Political Mandate
In Japan, Sanae Takaichi led the Liberal Democratic Party to a historic two-thirds supermajority… 316 seats in the lower house… the strongest governing mandate in modern Japanese history.
This isn’t a normal election result.
It is the beginning of a monetary and geopolitical rebalancing.
With this mandate, Japan can:
Pursue constitutional reform
Shift its national security posture
Support more aggressive BOJ normalization
Allow the yen to strengthen structurally
Japan has been a global liquidity exporter for more than a decade.
A pivot away from that role tightens global financial conditions… even if the Fed stands still.
This is how major FX cycles turn.
This is how global carry trades unwind.
This is how sovereign capital repatriation begins.
Japan is now a macro driver again.
4. The Super Bowl Halftime Show Flashes a Hard-Money Signal
In the middle of the 2026 Super Bowl halftime show… the most expensive, satanic, corporate-curated entertainment stage on earth… one image appeared that revealed more about societal psychology than any speech or headline this week:


A jewelry booth with a sign reading:
“COMPRO ORO Y PLATA — SOLO PAGO EN EFECTIVO.”
I buy gold and silver. Cash only.
This wasn’t a mistake.
It was… a reflection of deeper collective intuition.
It was an overt symbol to the elite to prepare.
When America’s biggest cultural broadcast features:
Hard assets
Cash-only transactions
Latin-American street-market imagery
Inside a performance celebrating cultural identity shifts
…it tells you something is happening beneath the surface.
Culture often reveals macro stress before markets price it.
And when gold and silver booths show up in front of 100+ million viewers, it means the collective mind has already begun questioning the stability of the financial system.
Not AI.
Not crypto.
Not tech.
Hard money.
This is the cultural mirror of the liquidity and geopolitical stress unfolding in real time.
5. Positioning Shock: The Billionaire Short, the SHFE Unwind, and the Real Battle Over Silver
While Western analysts debated narratives, something far more important took place inside the Shanghai Futures Exchange.

A major Chinese investor… reportedly billionaire Bian Ximing… had accumulated one of the largest silver short positions on SHFE:
≈450 tons
≈30,000 contracts
larger than combined SGE + SHFE deliverable inventory
And then it happened.
According to traders on the ground in China:
Huge silver shorts were closed at 3–4% ABOVE Friday’s futures close.
This is not what confident shorts do.
This is what traders do when:
Physical supply is tightening
Paper suppression is failing
The East wants metal, not exposure
And upside risk has become asymmetric
The January 30 liquidation freed up Western physical.
It flowed East.
And now Eastern shorts are paying up to exit positions.
This is the same pattern we identified last week:
📌 Western leveraged longs flushed
📌 Physical shaken loose
📌 Asia absorbs supply
📌 Paper positioning flips
📌 Upside pressure returns
Layer this with SG Commodity Compass showing gold tail-risk hedging at $10,000–$20,000, and the picture becomes unmistakable:
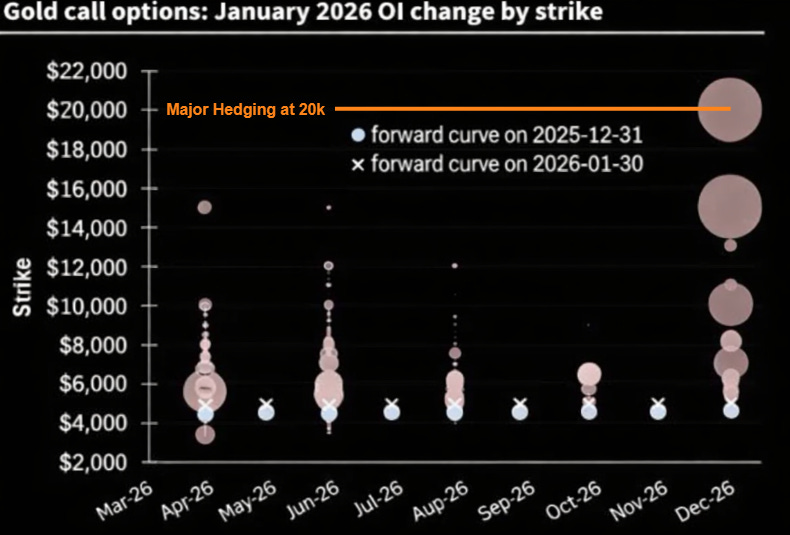
The suppression phase is ending.
The repricing phase is preparing to begin.
🔑 Key Market Themes & Weekly Asset Movements
(Price as of Friday, February 6, 2026)
U.S. Equities (S&P 500 & Nasdaq)
U.S. equities finished mixed and cautious to close the week. The S&P 500 closed at 6,932, modestly lower on the day as geopolitical uncertainties cloud sentiment. The Nasdaq Composite ended slightly lower around 25,075, amid broader market hesitation.Gold
Gold found support closing at $4,967/oz. Despite the violent drop the week before, the market remains fundamentally tight with central bank buying elevated.Silver
Silver found support at $77.94/oz. Despite the violent drop the week before, the market remains fundamentally tight. Paper markets unloaded the equivalent of 2.5× global annual mine supply in derivatives attempting to suppress price after silver hit recent all-time highs.GDX (VanEck Gold Miners ETF)
The VanEck Gold Miners ETF (GDX) found support at $97.39, reflecting the recent consolidation across the metals complex.SLVP (iShares MSCI Global Silver & Metals Miners ETF)
The iShares MSCI Global Silver & Metals Miners ETF (SLVP) closed up at $40.41, reflecting the recent consolidation across the metals complex.Crude Oil
Oil markets remained under pressure to start the year. WTI Crude prices pushed down around $63.49 per barrel, with rumors of the US naval blockade about to commence in Iran not coming to fruition.U.S. Dollar (DXY)
The dollar ended the week near 97.37, spiking higher as markets absorbed the news of Warsh as the new Fed nominee.Bitcoin
Bitcoin sold off sharply closing last Friday around $70,531 as speculative interest and institutional participation remain uneven at current levels.
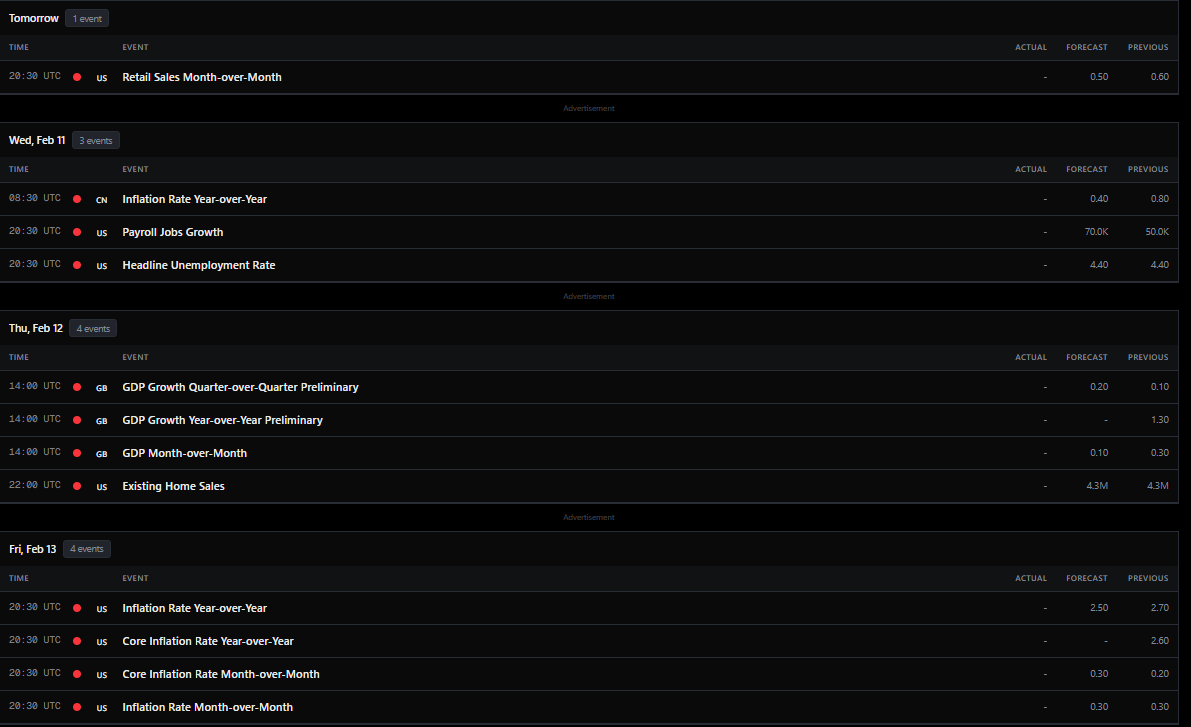
🗓️ Economic Calendar — Key Events This Week
US – Tuesday, Feb 10
Retail Sales Month-over-Month
China – Wednesday, Feb 11
Inflation Rate Year-over-Year
US – Wednesday, Feb 11
Payroll Jobs Growth
Headline Unemployment Rate
UK – Thursday, Feb 12
GDP Growth Quarter-over-Quarter (Preliminary)
GDP Growth Year-over-Year (Preliminary)
GDP Month-over-Month
US – Thursday, Feb 12
Existing Home Sales
US – Friday, Feb 13
Inflation Rate Year-over-Year
Core Inflation Rate Year-over-Year
Core Inflation Rate Month-over-Month
📊 Featured Chart Breakdown
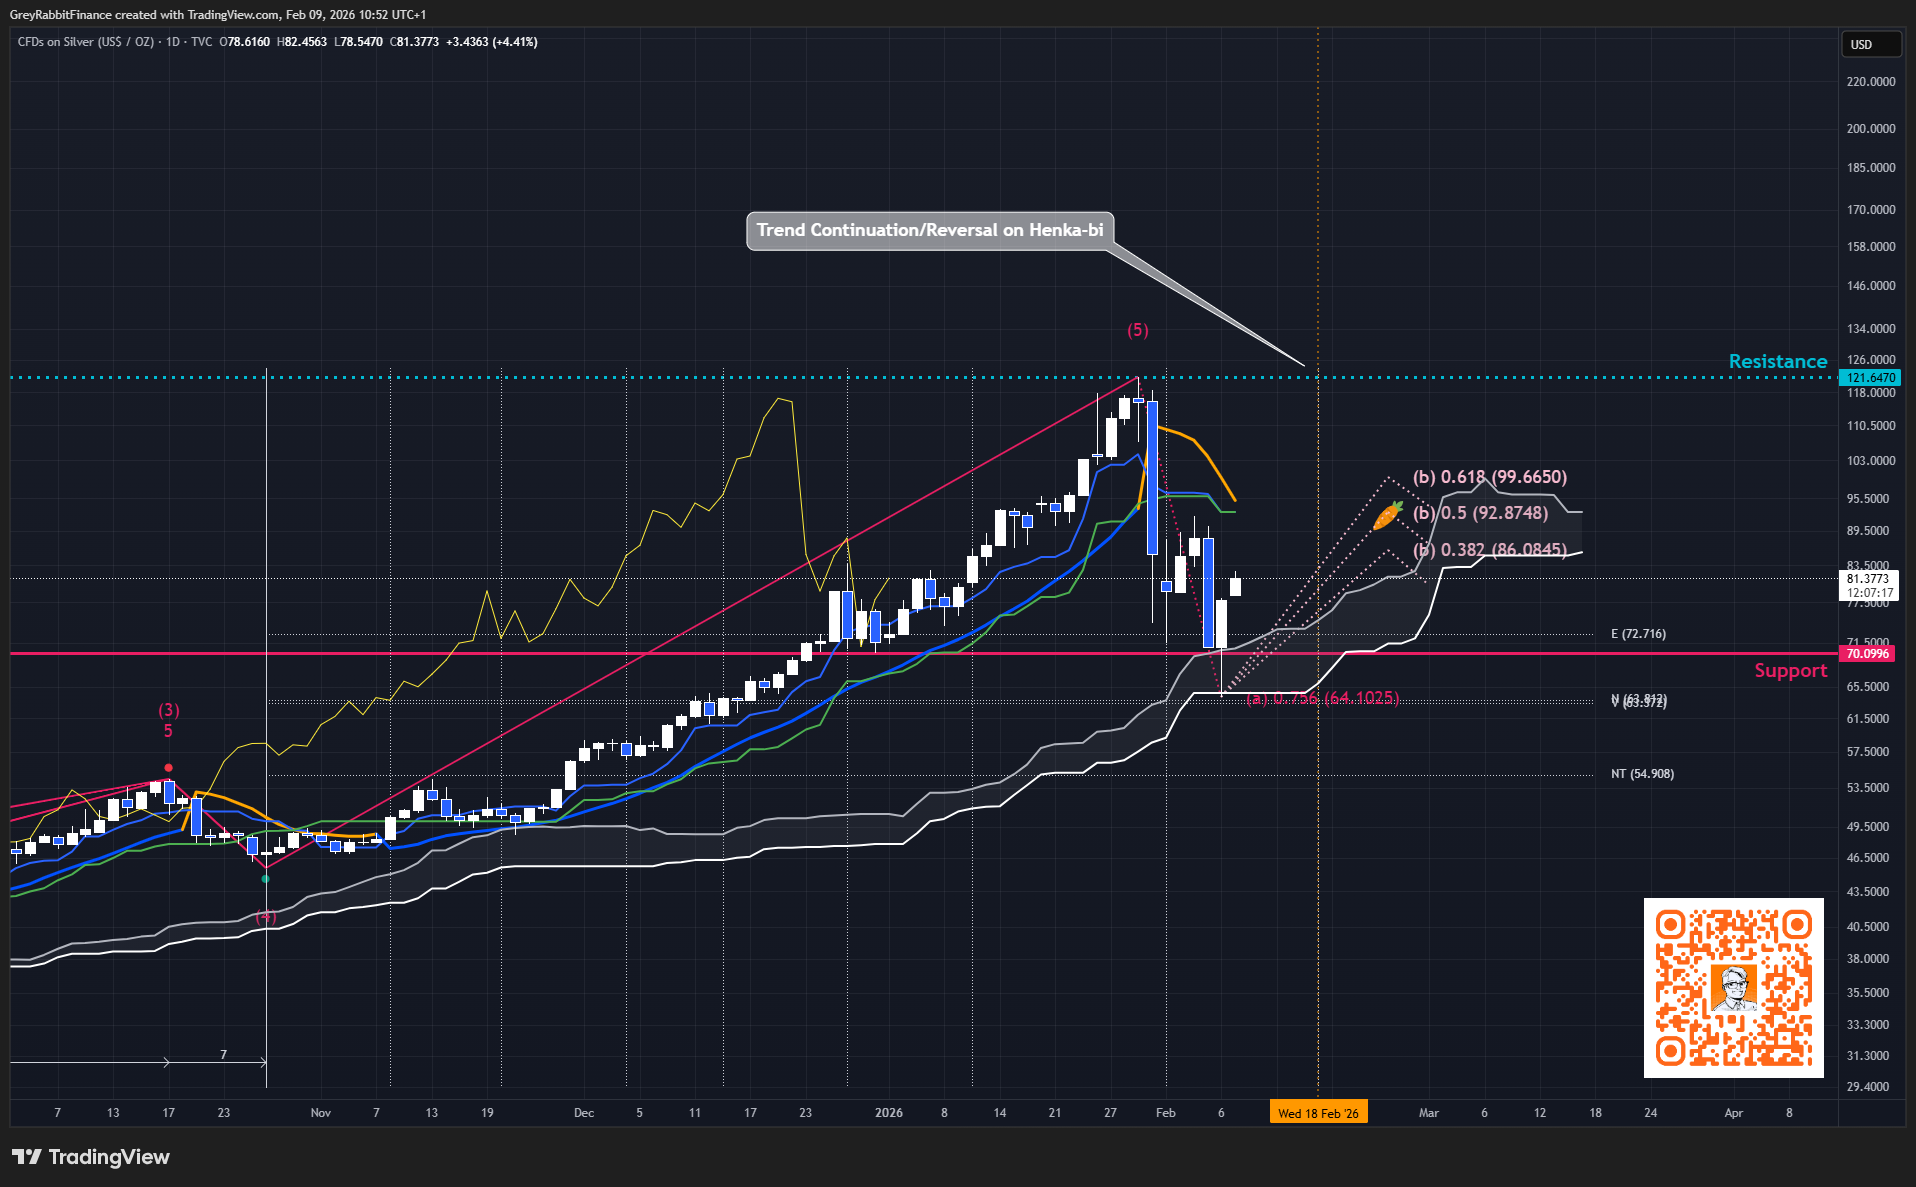
Silver/USD (Daily Chart)
Trend: Bullish (Consolidating)
Resistance: 121.64
Key Support: 70.09
Buy Zone: 86.08–70.09
Timing Watch: Henka-Bi Cycle — Feb 18
Trend
Silver remains in a primary bullish trend despite the liquidation event.
Price never closed below the Ichimoku cloud, higher-timeframe structure remains intact, and the broader channel still points upward.
This was a liquidity sweep reset, not a reversal.
Recent Price Action
Silver completed its Wave (3) extension into the last Henka-bi window, then experienced a sharp but controlled drop into the major support zone around 70.09.
From there:
Buyers stepped in aggressively
Price rebounded toward 83–89
Structure held above the cloud and above the long-term trendline
The flush cleaned out leverage but left the bull trend untouched.
Interpretation
Resistance remains the same:
121.67 (major structural resistance)
126.00 (Wave 5 extension target)
The selloff did not build new resistance zones — it simply removed excess froth and reset Ichimoku overextension.
This is a classic Wave (4) corrective pattern:
Deep wick
Reclaim of mid-range
Compression into equilibrium
Preparing for Wave (5) continuation
The chart still reflects the early stages of a parabola, not the end of one.
Technical Structure
Retracement / Wave B:
86.08 — 0.382
92.87 — 0.50
99.66 — 0.618
70.09 — Key swing support
Ichimoku Supports:
E ≈ 72.7 — Cloud edge support
63.87 → 58.43 — Deep cloud / cycle support
54.90 — Long-term NT floor
Wave Count:
Wave (3): Complete
Wave (4): Currently unfolding
Wave (5): Targeting 121–126
Everything aligns: Ichimoku equilibrium, fib retracements, and Elliott structure all support a continuation scenario.
Timing
A major Henka-bi timing window hits Feb 18, which historically produces either:
A trend continuation burst, or
A final corrective dip before the breakout
Given the current structure:
Volatility has compressed
Tenkan/Kijun have reset
Price sits in equilibrium
Wave (4) is mature
Cloud support is stable
The Feb 18 window strongly favors a Wave (5) ignition.
Only a close below 70.09 would invalidate this.
Summary
Silver remains structurally bullish.
The liquidation event was a healthy reset, not a top.
Wave (4) appears nearly complete and Silver is tracking toward a Feb 18 timing inflection that could initiate Wave (5) toward 121–126.
This is still a buy-the-reset bull market, not a distribution top.
📈 For full context, see my Silver 2026: Full Steam Ahead, which outlines the annual macro thesis, key Ichimoku levels, and trading framework behind this move.
💡 New to Ichimoku?
Grab my audio & eBook “At One Glance: Master the Ichimoku…” — it breaks down my charting method with real examples and setup logic.
🔒 Premium Analysis
👇 What’s behind the paywall:
✅ Full Ichimoku chartbook: BTC, SP500, Gold, Silver, Oil, GDX, SLVP, DXY
✅ Key support/resistance zones + Henka-Bi Time Cycle Windows
✅ Actionable trade plans and targets
✅ Weekly macro catalyst watch
