


BRICS Summit vs Big Beautiful Bill: Cage Match at the White House Lawn — Macro Market Report
Key Charts: Stocks, Oil, Gold, Silver, Miners, DXY, and Bitcoin — What to Watch This Week


Washington stole the spotlight as President Trump signed the controversial “One Big Beautiful Bill” on July 4—a sweeping $4.5 trillion+ fiscal package that permanently extends Trump-era tax cuts while slashing major social and green energy programs. Critics like Elon Musk slammed the bill, warning of a ballooning deficit and a projected 11 million Americans losing health coverage. Meanwhile, Trump stirred headlines with a cultural curveball: plans to host a UFC championship fight on the White House lawn next July to mark America’s 250th birthday.
Across the Atlantic, UK markets steadied after PM Starmer and Chancellor Reeves aligned on fiscal policy, and in the EU, trade negotiators scrambled to avert new tariffs as the 90-day deadline approached, once again delayed until August 1st. Meanwhile, attention turned to Brazil, where the annual BRICS summit kicked off in Rio de Janeiro. Major themes included de-dollarization, new energy trade alliances, and the possible rollout of a BRICS settlement currency, all of which added fresh fuel to the hard asset narrative.
Equities pushed to fresh highs last week following the June jobs report (+147,000 payrolls, 4.1% unemployment). However, Treasury yields climbed and the U.S. dollar firmed as bond markets digested the implications of long-term fiscal expansion and potential inflation pressures. Risk appetite remained intact—but macro positioning is increasingly sensitive to policy shifts.
📅 What to Watch This Week (July 6–11):
📄 FOMC Minutes (July 9) – Markets will pore over the Fed’s June meeting minutes for clarity on rate outlooks.
💵 U.S. Economic Data:
July 10: Initial jobless claims
Consumer credit (June)
🎤 Fed Speakers – Multiple Fed officials are set to speak this week, which could sway rate expectations.
💼 Earnings Season Begins – Watch Delta Air Lines and Conagra (July 10) as early bellwethers.
🛒 Prime Day (July 11–13) – Amazon kicks off its multi-day sale, offering clues about consumer strength heading into Q3.
Let’s hop into the charts now and break it all down.

📊 Key Charts:
Bitcoin (Daily Chart)
Price Action: Bullish Candle
Ichimoku 5 Lines: Kumo Twist (Bullish) - Ranging Market
Ichimoku Cloud: Bearish Kumo Cloud
Entry Zone: Breakout and retest of $112,000
Catalyst Watch: FOMC Minutes, BRICs Summit
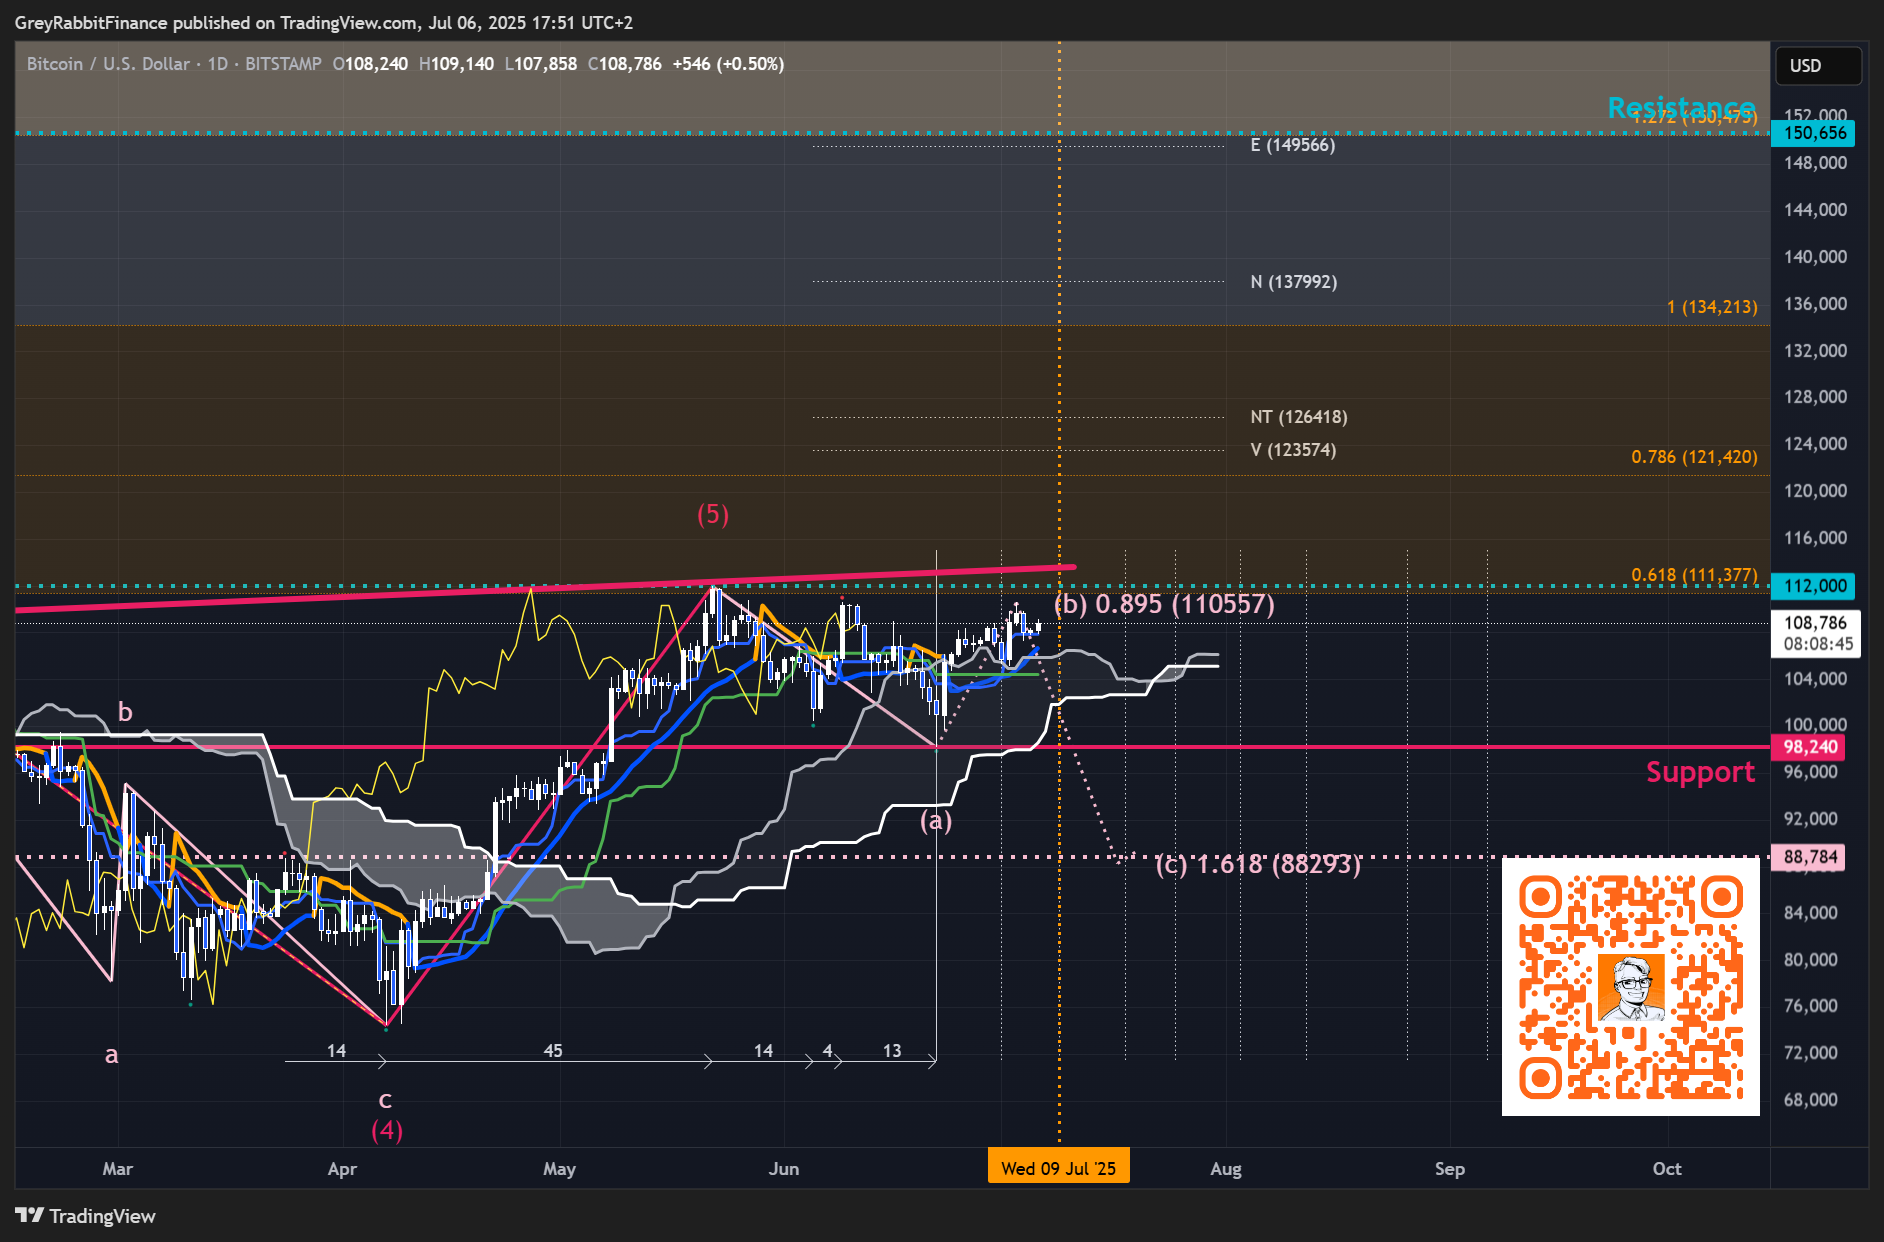
Bitcoin recently pulled back to a healthy retracement zone near $98,240 after the false breakout we flagged around $112,000.
As noted last week, false starts remain a key risk at this stage of the cycle, so patience is essential. I’m watching for a confirmed N-Wave close above $112,000, ideally followed by a clean retest of that breakout level to validate upside continuation.
At the moment, there’s no clear low-risk entry, so I’m not recommending new positions just yet.
For those already positioned, the next major upside target remains $150,000. That said, we could still see a retracement toward $88,293 in the short to medium term, especially if the market fails to reclaim key levels.
The upcoming Henka-Bi on July 9th will be a critical timing point—watch for either a trend continuation to the downside or a bullish reversal signal.
Key support to hold:
$88,784 – the 0.618 Fibonacci retracement. A decisive close below this level would break market structure and open the door to deeper downside.
SP 500 (SPX - 4 Hour Chart)
Price Action: Bullish Big Bodied Candlestick
Ichimoku 5 Lines: 5 Lines Up - Bullish Trend
Ichimoku Cloud: Bullish Kumo Cloud
Entry Zone: Not looking for entries currently.
Catalyst Watch: Geopolitical Tensions (Israel/Iran), FOMC Minutes, QE Restarts soon?

Last week, price confirmed the N-Wave close above the 6,000 level, breaking major resistance for the third time.
The N-Wave close above the 6,147 level—now paves the way toward our next upside targets at 6351, 6413 and 6813.
On the 4 hour Chart, momentum appears to be strengthening again, however a breakdown could send us toward the 6,087 level as an initial downside target.
By the upcoming Henka-Bi cycle on July 11, we should have clearer evidence of the market’s next directional move.
Want the full annotated charts and setups? Or have a personal technical analysis request?
Keep reading with a 7-day free trial
Subscribe to Grey Rabbit Finance's Substack to keep reading this post and get 7 days of free access to the full post archives.